-
Bitcoin remains under heavy selling pressure after losing a key support zone, with bears maintaining control of the short-term trend.
-
Bearish sentiment is intensifying as Bitcoin demand falls sharply, while weakening network activity raises concerns about investor participation.
-
BTC has tested a crucial support level twice since yesterday, increasing the risk of a breakdown below $60,000.
The recent breakdown from the crucial support zone around $65,000 seems to have shaken the market confidence, as the Bitcoin price is failing to attract buyers’ attention. The price is currently trading around $63,000, after testing the support below $61,500 for the second consecutive day since yesterday. Besides, it is also facing signs of weakening demand both in spot and futures, which have fueled the bearish sentiments.
This raises questions about whether Bitcoin is experiencing a temporary demand showdown or if the market is witnessing a structural breakdown.
Bitcoin Demand Has Fallen to Cycle Lows
Bitcoin’s demand profile has deteriorated sharply, with CryptoQuant data showing spot and futures demand plunging to some of their weakest levels of the current cycle.
The 30-day combined demand metric has fallen deep into negative territory, signaling a significant slowdown in buying pressure despite BTC continuing to trade near elevated levels. Historically, such periods have coincided with weakening momentum and increased downside risk.
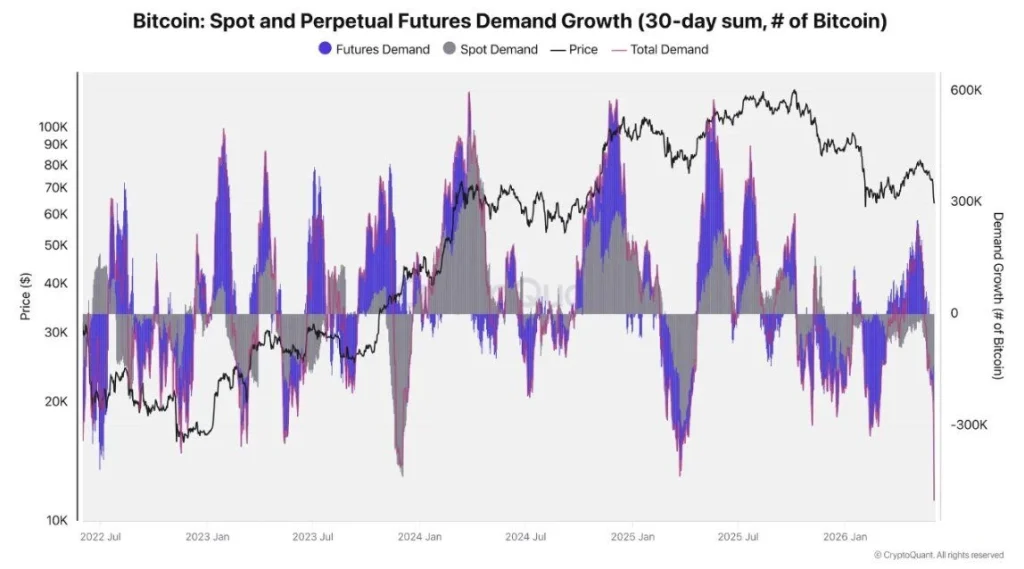
The divergence is becoming difficult to ignore. While price remains relatively resilient, demand continues to contract, suggesting the market may be relying on existing holders rather than fresh capital to sustain current valuations. If demand fails to recover, the gap between price and participation could become increasingly difficult to maintain.
Network Activity Signals a Bigger Problem
Bitcoin’s network activity continues to weaken, with active addresses falling to their lowest levels in more than seven years. The decline has pushed utilization metrics back to levels last seen during the 2019 bear market, highlighting a notable drop in user participation.

The trend stands in sharp contrast to Bitcoin’s elevated valuation. While price remains relatively resilient, network activity has failed to show a similar recovery, creating a growing divergence between participation and market performance. This suggests demand is falling, activity is shrinking, and the gap between fundamentals and price continues to widen.
Is Bitcoin Price About to Follow
Bitcoin has now revisited the crucial support zone around $62,000-$64,000 for the second time in recent weeks, highlighting growing weakness within the broader market structure. On the weekly timeframe, the RSI has dropped to its lower threshold for the second time this year, signaling that momentum remains firmly tilted toward the bears. Historically, repeated tests of these levels have often preceded either a decisive breakdown or an extended consolidation phase.
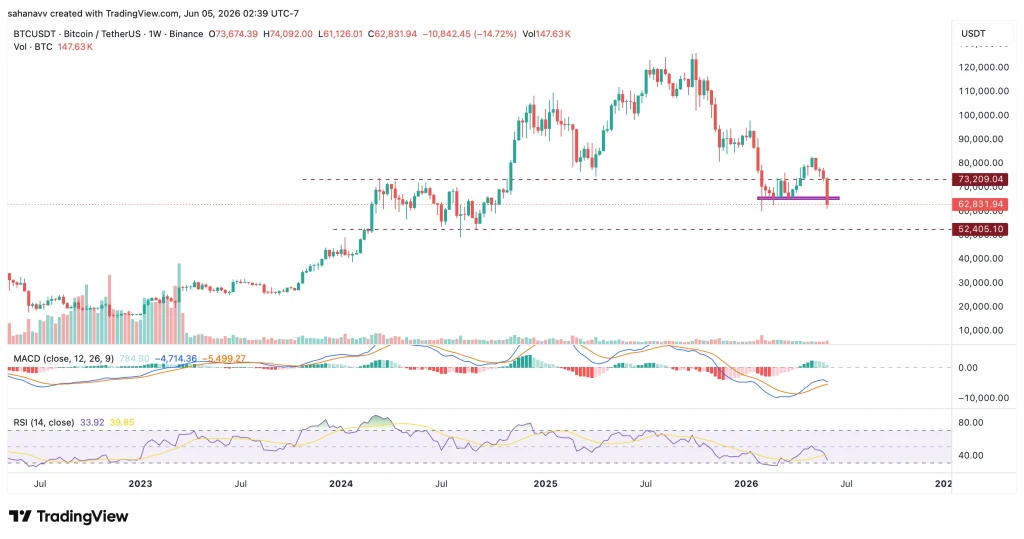
Meanwhile, the weekly MACD shows a drop in buying pressure, which may further trigger a bearish crossover. Moreover, the levels remain within the negative range since the start of the year, raising concerns over the upcoming price action. A breakdown below the current support region could expose the next major demand zone near $52,000, while a successful defense may offer the market an opportunity to stabilize and attempt a recovery.
What’s Awaited for BTC Price By the End of Q2, 2026?
Bitcoin (BTC) price enters the final weeks of Q2 under pressure as demand falls to cycle lows and network activity continues to weaken. The technical picture also remains fragile, with the weekly RSI testing its lower range and the MACD nearing a bearish crossover below zero.
For traders, the $62,000-$64,000 support zone remains critical. Losing this level could open the door to a decline toward $52,000. Conversely, a recovery above $73,000 may revive bullish momentum and pave the way for a move toward $80,000-$85,000. Until demand shows signs of recovery, the risk remains skewed to the downside.