

AVAX price crashes to early 2021 support, is a bottom forming?
AVAX price crashed to levels last seen in early 2021 after a market-wide liquidation wave erased support near $8 and left traders heavily bearish.
- AVAX price has fallen to levels last seen in early 2021 after a crypto-wide liquidation event wiped out key support zones.
- Open interest dropped to $159 million while more than 70% of derivatives positions remained short, highlighting bearish market sentiment.
- Traders are watching the $6.25 “Ultimate Support” level, with a break below potentially exposing AVAX to further downside toward $5.46 and $4.68.
According to data from crypto.news, Avalanche (AVAX) fell 14% to an intraday low of $6.26 on Saturday, June 6, its lowest level since January 2021, before stabilizing at $6.64 at press time.
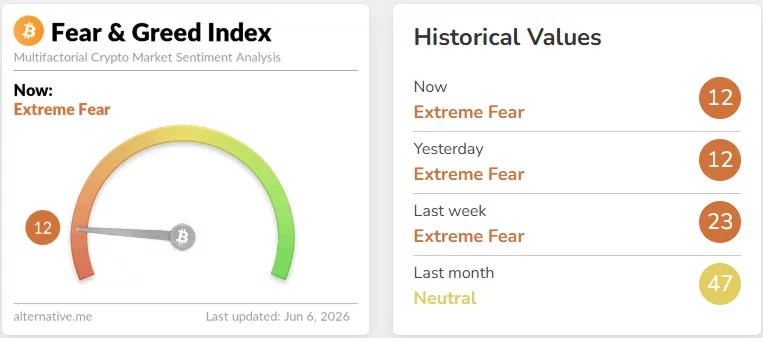
The sharp decline came after Bitcoin (BTC) briefly fell below the key $60,000 support level and touched nearly $59,000, prompting traders to reduce risk as leveraged long positions were liquidated, and the Crypto Fear & Greed Index fell to 12 and remained in Extreme Fear territory, underscoring the deteriorating sentiment across the digital asset market.
Leverage flush leaves AVAX near early 2021 range
The move was not driven by a clear Avalanche-specific network failure. Before the selloff, Avalanche had seen stronger institutional and on-chain activity, including more than $1.16 billion in on-chain real-world assets and the launch of regulated AVAX futures by CME Group.
Those developments offered little protection once the market entered a forced deleveraging cycle. The additional context showed more than $1.86 billion in long liquidations across crypto derivatives, with high-beta layer-1 tokens such as AVAX absorbing sharper losses than Bitcoin.
Derivatives positioning also weakened. Open interest in AVAX fell to about $159 million, showing fewer traders were willing to keep capital in active positions during the decline. At the same time, more than 70% of positions were shorts, leaving the market tilted toward further downside rather than a fast recovery.
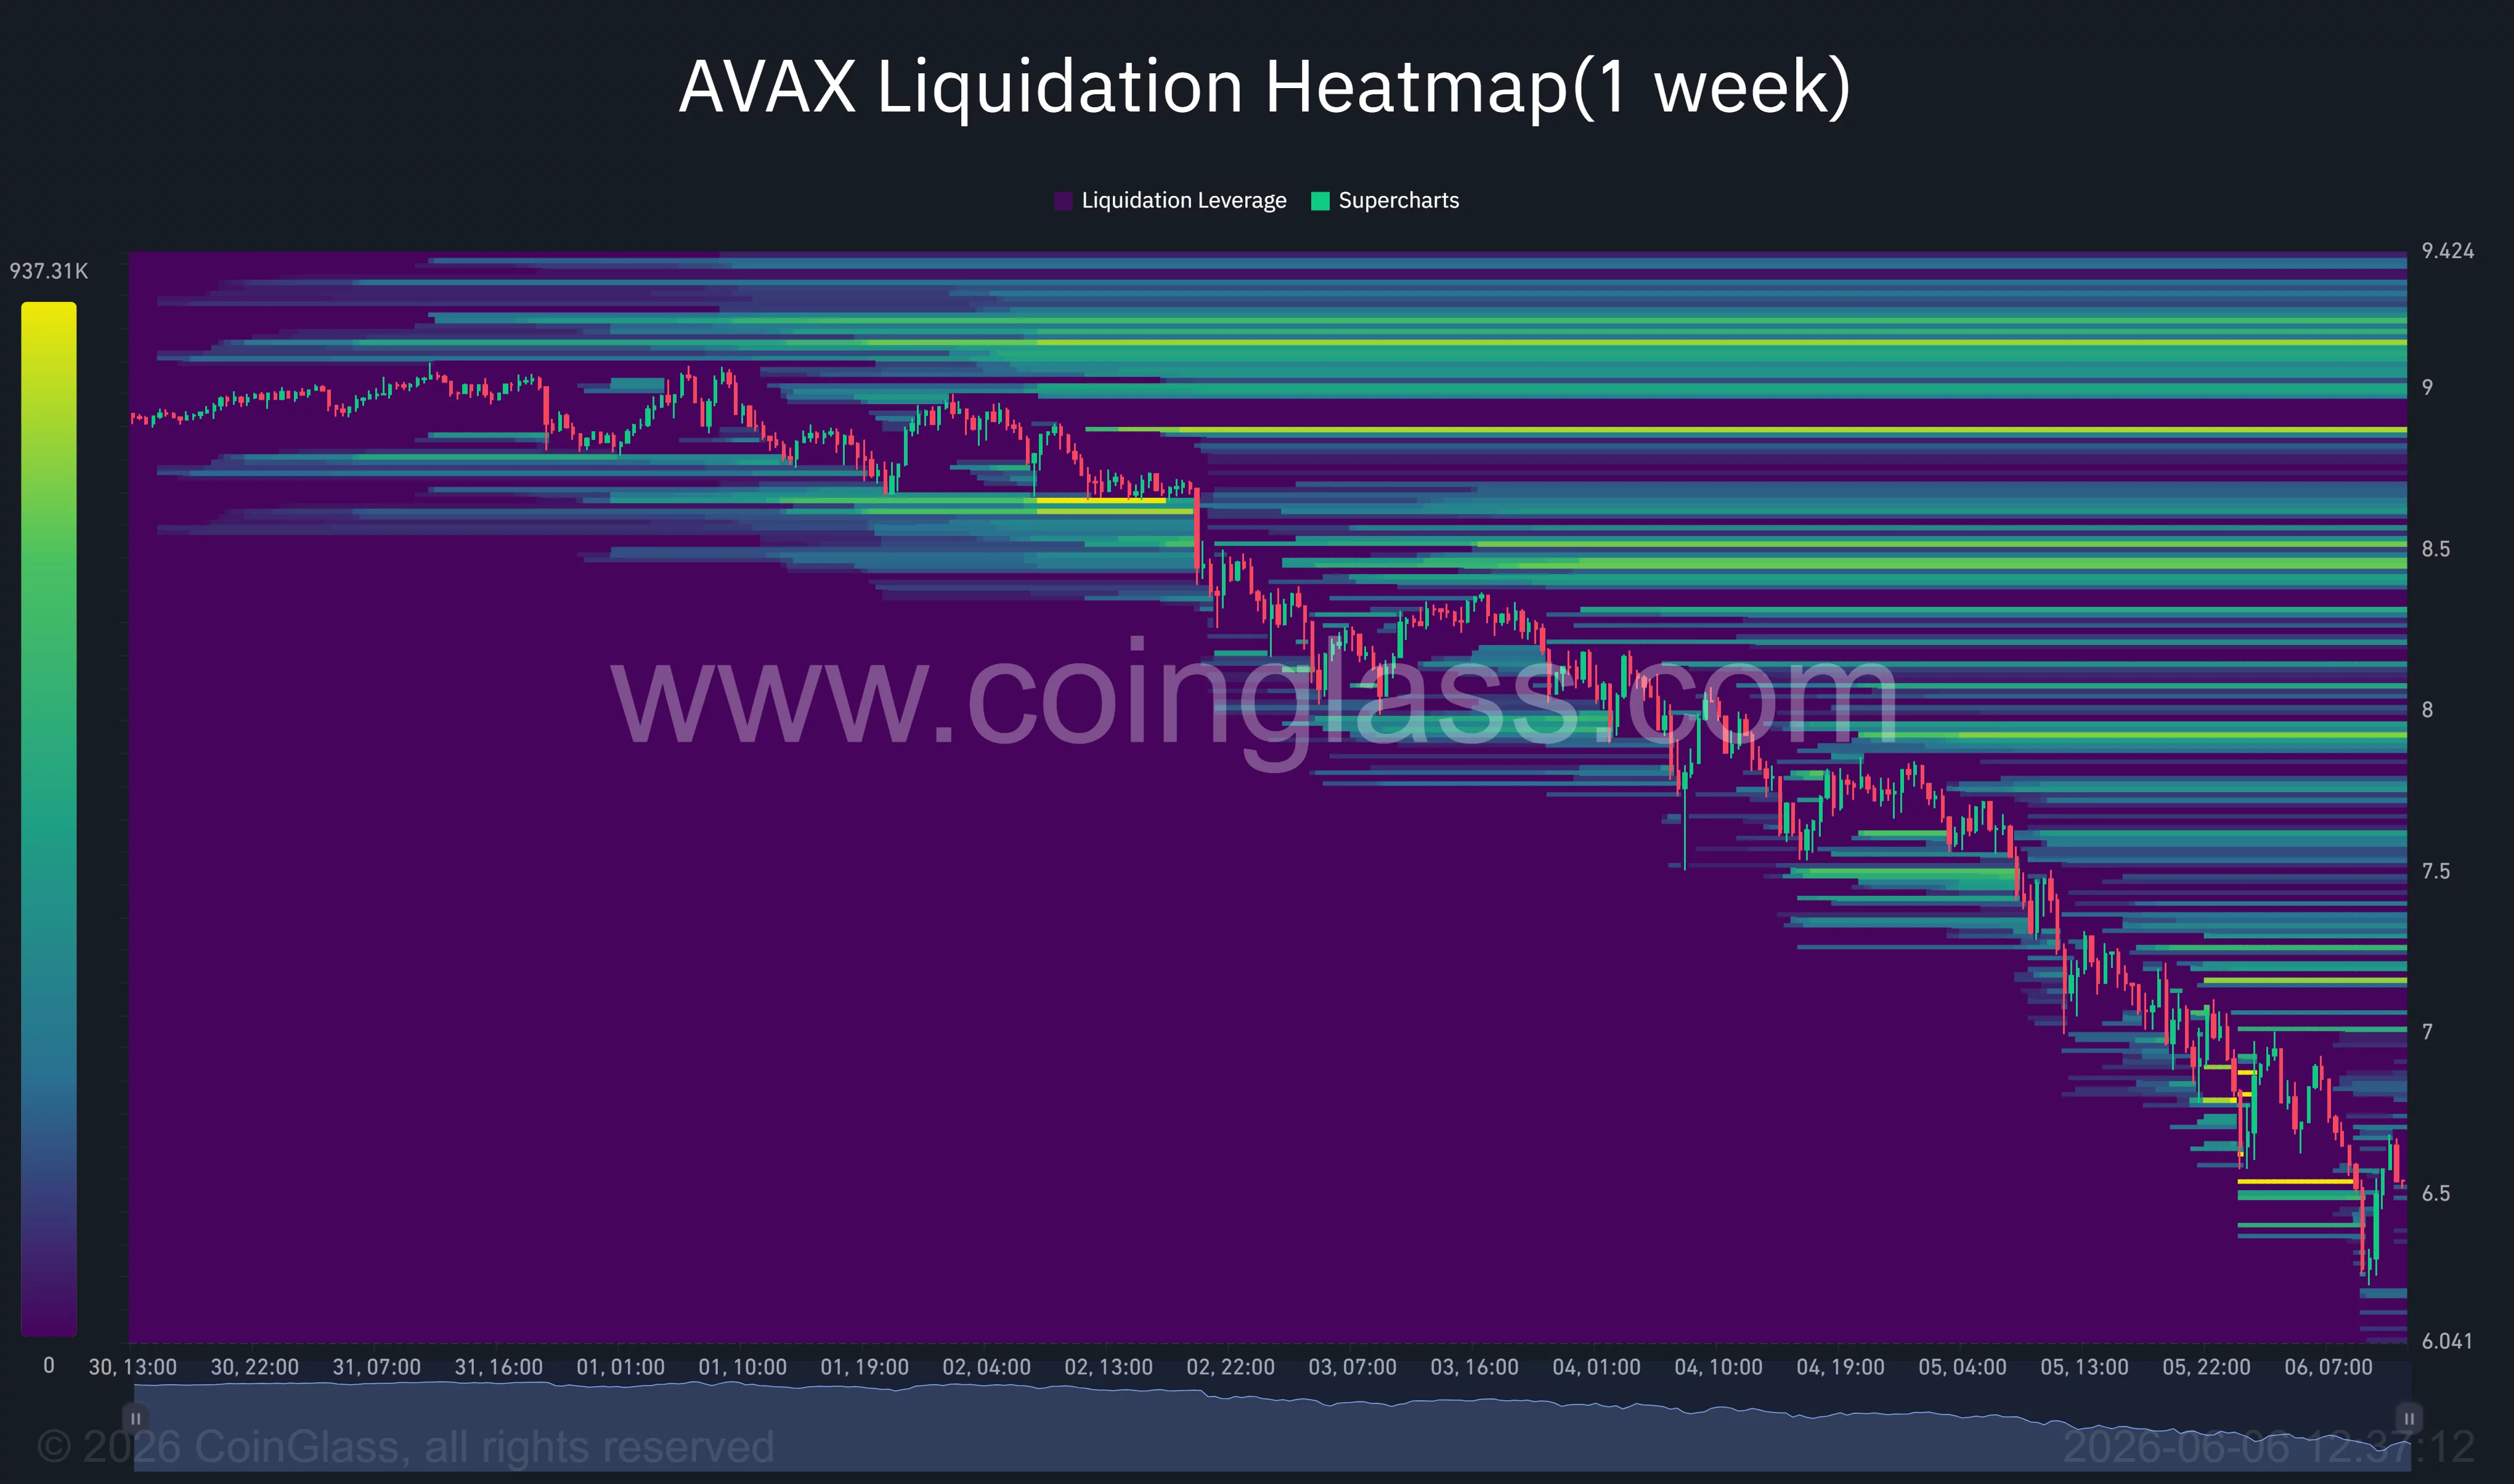
CoinGlass liquidation heatmap data shows heavy leverage above the current price, especially around $7.00, $7.50, $8.00, $8.50, and the $8.80–$9.20 zone. A rebound into those levels could trigger short liquidations, but current price action has not yet shown enough spot demand to force that squeeze.
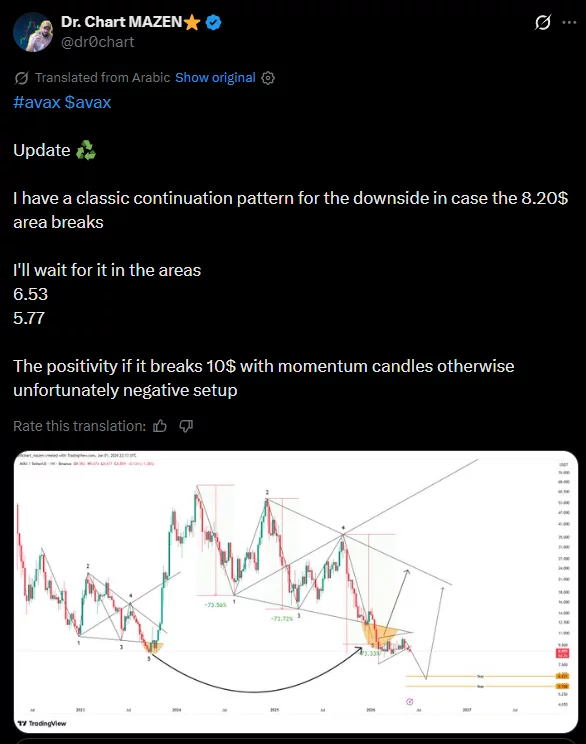
According to an earlier X post by analyst Dr. Chart MAZEN, AVAX still carries downside continuation risk unless buyers reclaim higher levels. “I have a classic continuation pattern for the downside in case the 8.20$ area breaks,” the analyst wrote, adding that he was watching “6.53” and “5.77” as lower areas.
Technical setup keeps the bottom case fragile
AVAX fell close to its final major Murrey Math support zone near $6.25 earlier today, a level labeled ‘Ultimate Support’ on the daily chart. The token previously lost the $7.81 and $7.03 support bands during the liquidation-driven selloff, leaving the $6.25 area as the key line bulls must defend to prevent a deeper decline toward the oversold region near $5.46.
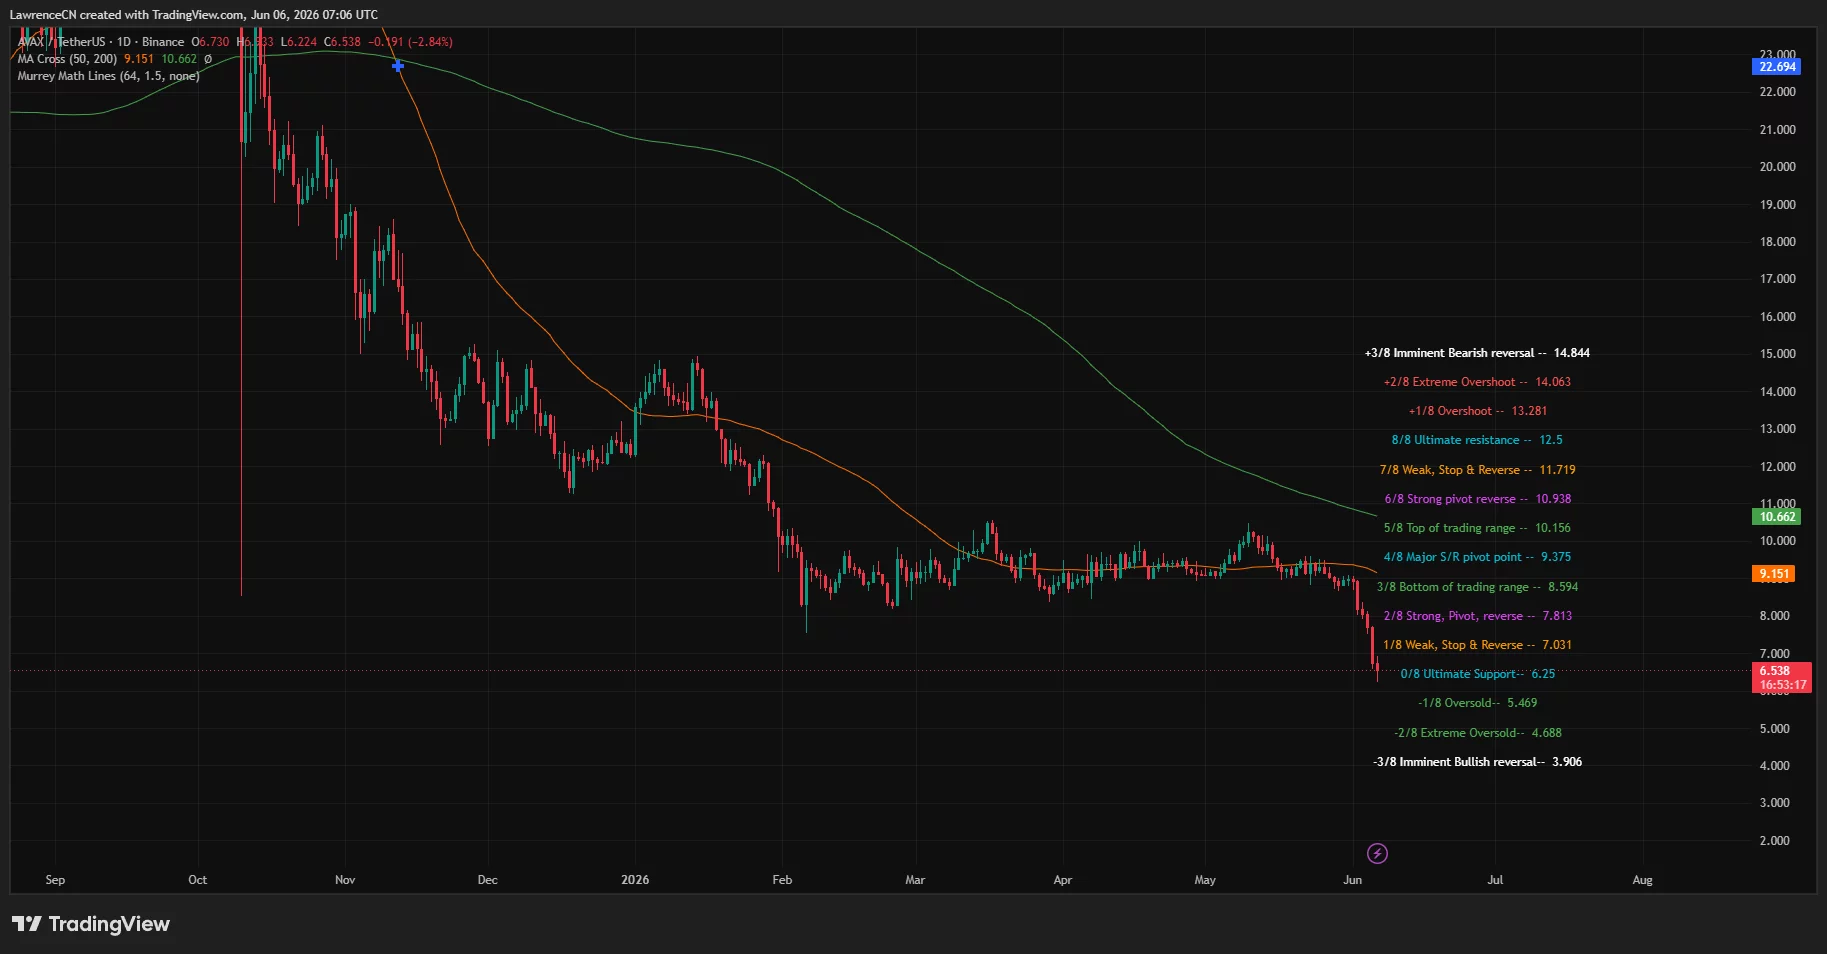
At press time, AVAX was trading below both the 50-day moving average at $9.15 and the 200-day moving average at $10.66.
Reclaiming those levels would be necessary to restore a bullish market structure, although the token’s defense of the $6.25 support zone has begun attracting attention from traders looking for signs of a longer-term bottom.
Resistance now sits near $7.03, followed by $7.81 and $8.59. A close above $8.20 would weaken the downside continuation setup described by Dr. Chart MAZEN, while a stronger move above $10 would bring the 200-day average and major trend resistance back into focus.
Downside risk remains clear. A daily close below $6.25 would keep sellers in control and expose AVAX to the -1/8 Murrey level near $5.46. Below that, the next major downside area sits near $4.68, while Dr. Chart MAZEN’s $5.77 level may act as the first test before deeper capitulation.
AVAX can still form a bottom if buyers defend the $6.25–$6.50 range and force shorts to unwind above $7.50. Until price reclaims $8.20 with strong volume, the chart favors a damaged recovery attempt rather than a confirmed reversal.
Disclosure: This article does not represent investment advice. The content and materials featured on this page are for educational purposes only.


You May Also Like

Not a loophole: Singapore AI export controls let China tap US AI legally

Exclusive interview with Smokey The Bera, co-founder of Berachain: How the innovative PoL public chain solves the liquidity problem and may be launched in a few months

Crypto Hack: Drift Protocol Drained Over $200M in Private Key Breach


