

Ethereum price rebounding: technical trap with Fear & Greed at 20?

As of June 15, 2026, the Ethereum price is hovering around $1,718, in an area that requires caution. The price is suspended between a short-term recovery and a still-compromised daily structure. Looking only at the hourly chart gives a partial idea — and can be costly.
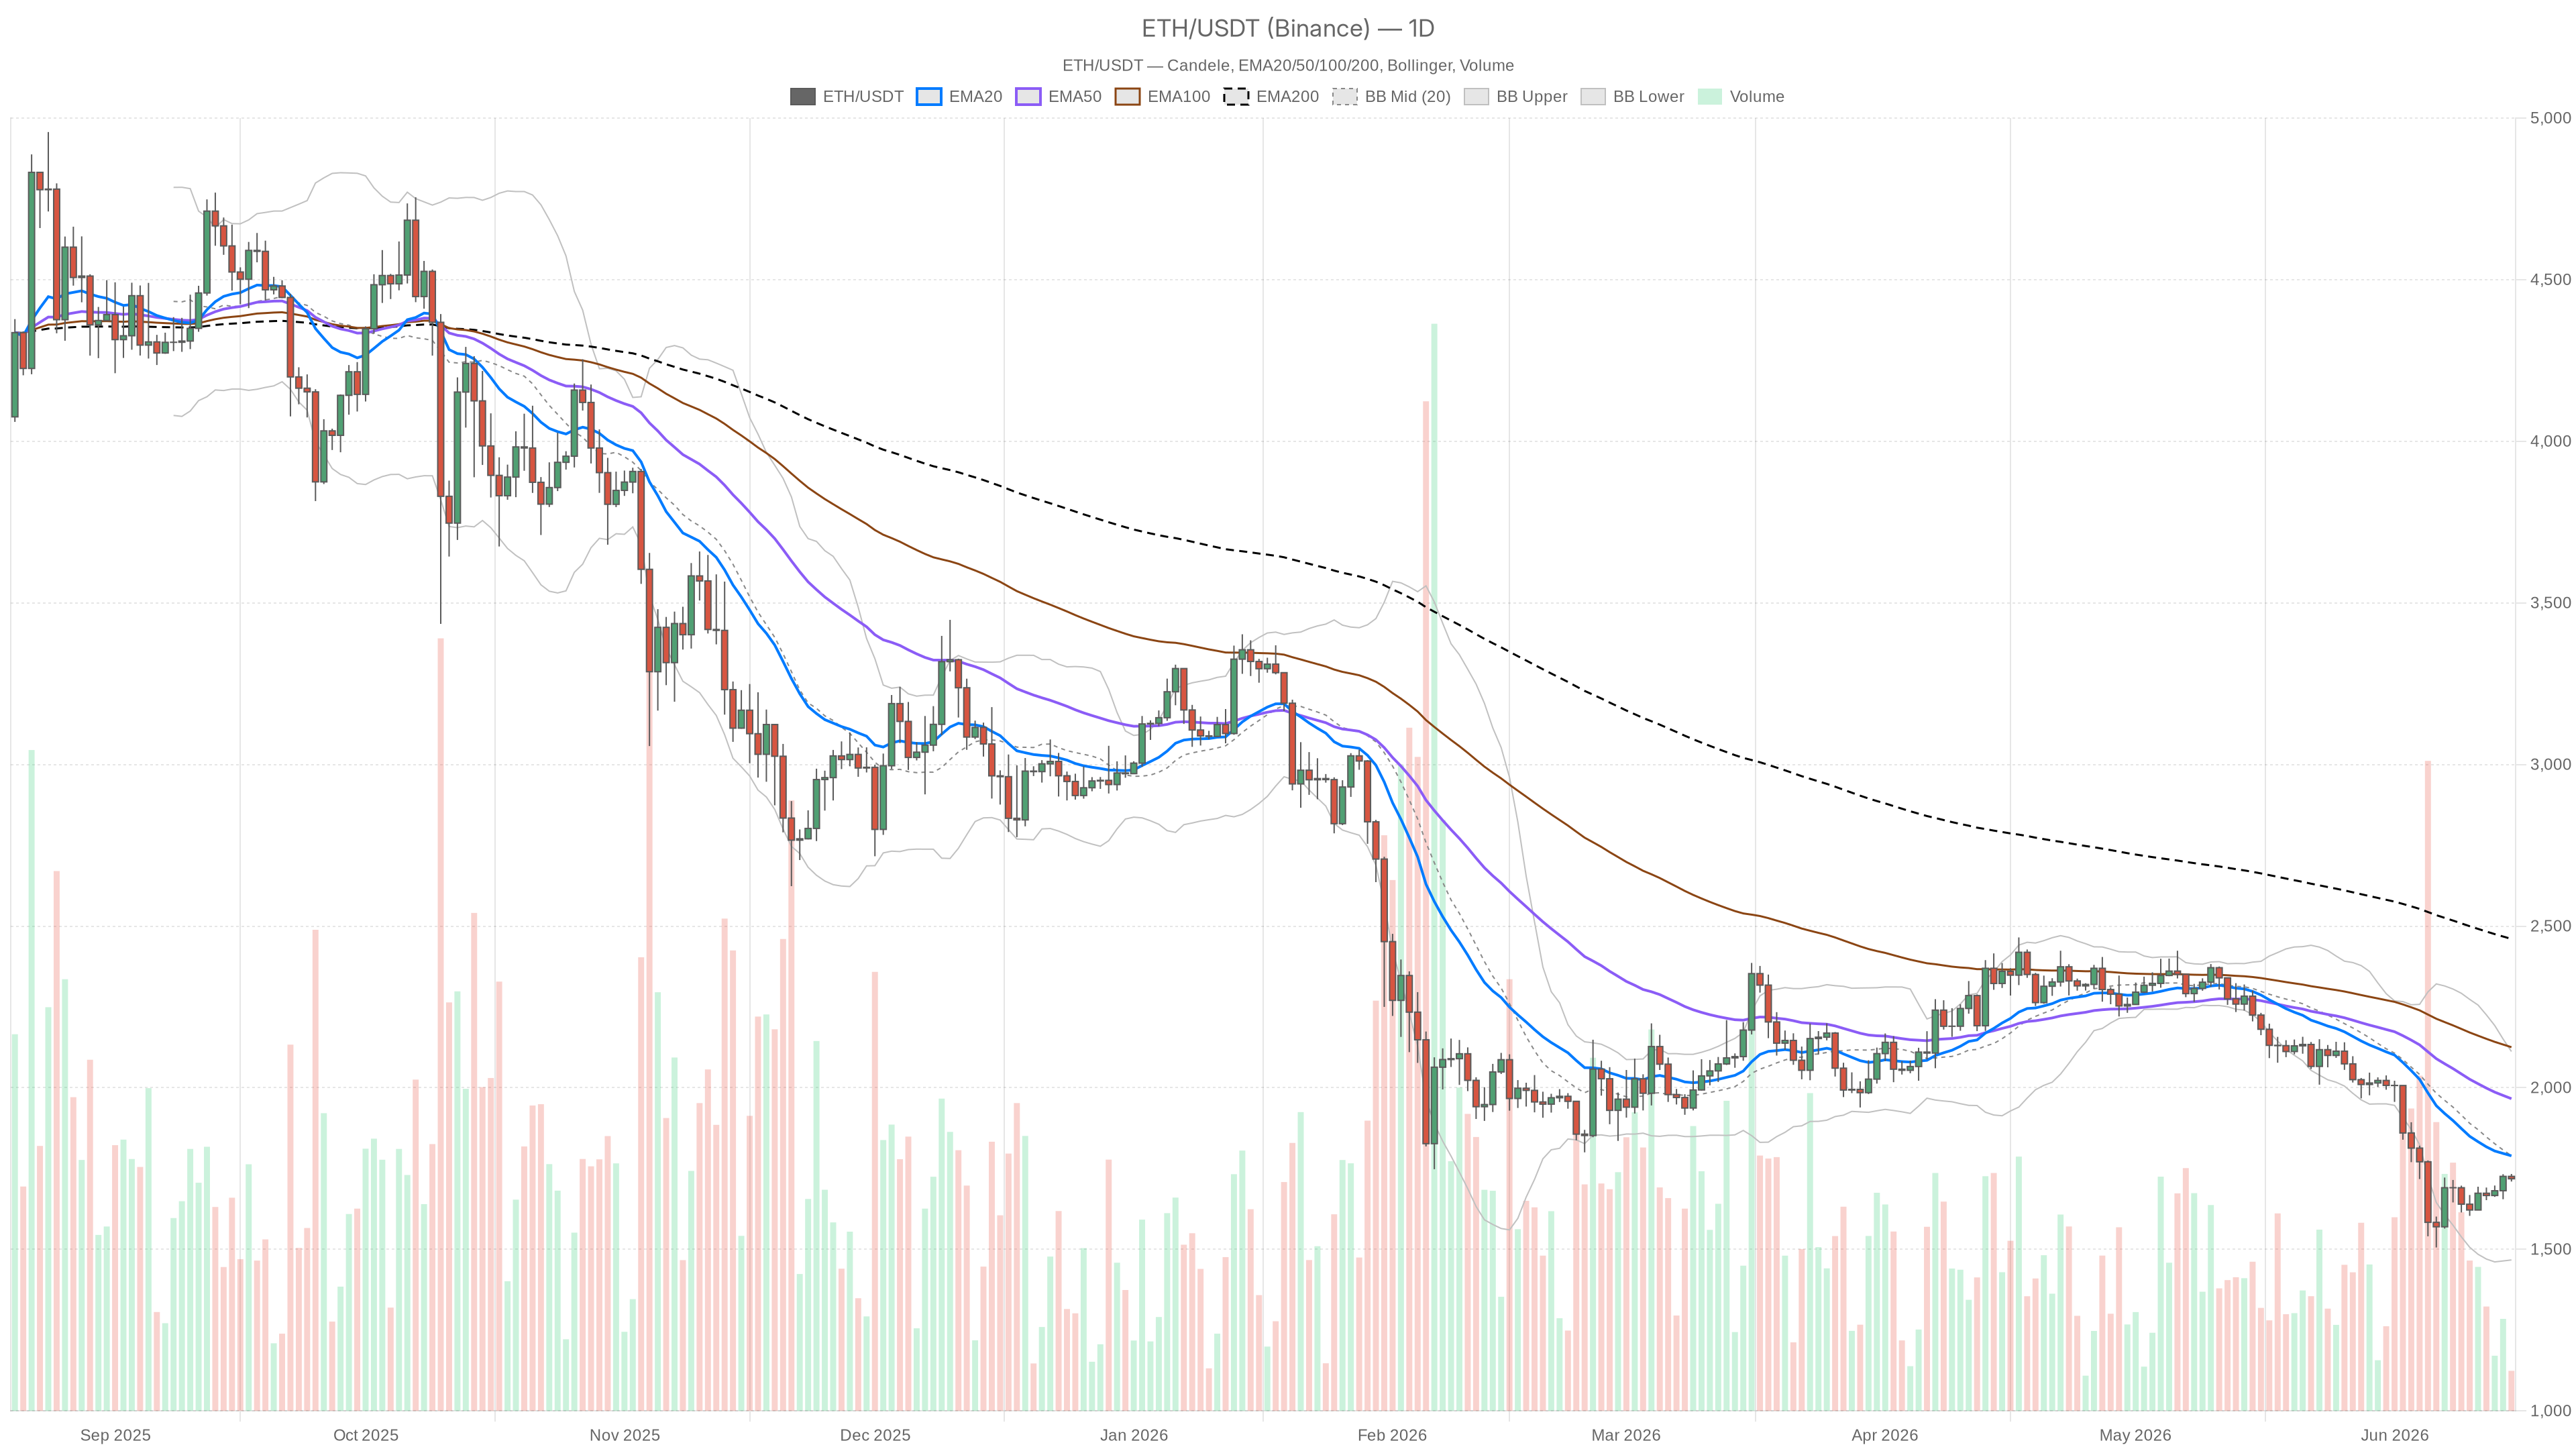 ETH/USDT — daily chart with candles, EMA20/EMA50 and volumes.
Key points
- Price at $1,718, below EMA20 (1,789), EMA50 (1,965) and EMA200 (2,460): classic bearish alignment.
- Daily RSI at 37.35 with Fear & Greed Index at 20 (Extreme Fear): weakness not yet exhausted.
- Bounce on H1 with RSI at 67.57: momentum running out with no structural levels reclaimed.
- Key resistance at $1,789 (daily EMA20), critical support at $1,467 (lower Bollinger band).
- Bitcoin dominance at 56.65%: capital concentrated on BTC, Ethereum in relative weakness.
The dominant structure is bearish, without ambiguity
On the daily timeframe, the value of Ethereum is positioned below all the key exponential moving averages: EMA20 at 1,789, EMA50 at 1,965, EMA200 at $2,460. This is not a neutral consolidation configuration — it is a classic bearish alignment, in which every attempt to move higher encounters structural selling pressure. The price does not even need to get very close to these levels for resistance to be felt: EMA20 alone is almost 4% away from the current price and historically acts as a ceiling in contexts like this.
The 14-period RSI on the daily is at 37.35 — not yet in technical oversold territory, but clearly in a zone of weakness. This means there is still room to the downside before the market reaches levels where heavyweight contrarian buyers typically emerge. It is not a signal of an imminent buy: rather, it confirms that the bearish strength has not yet run its course.
The daily MACD tells the same story, with the line at -113.67 and the signal at -125.96. The histogram at +12.29 shows a slight improvement in momentum — the differential between the two lines is narrowing — but we are still well in negative territory. A hint of positive divergence, not a turning point. Anyone reading this as a buy signal on the daily is seeing what they want to see.
In the short term, there is a bounce — but pay attention to where we are
Moving to the hourly chart, the context changes radically. The price of ETH is trading above EMA20 (1,702), EMA50 (1,688) and EMA200 (1,683) on H1 — all aligned in a bullish way and compressed together, a sign of a recovery that has had a certain solidity over the last few sessions. The one-hour MACD is positive, with a histogram at +2.1, and the RSI at 67.57 shows momentum that has pushed decisively. The problem lies exactly here: an RSI near 70 on H1, after a rise from the lows, is more of a warning bell than a confirmation. It is not absolute overbought, but a signal that the fuel for the bounce is running out without the price having reclaimed structurally significant levels.
The Bollinger Bands on the daily, with the upper band at 2,111 and the lower at 1,467, show considerable width — the daily ATR is at $96, which in practice means that daily swings of that size are the norm, not the exception. Operating in this context requires precise risk management: volatility is high and false signals are frequent precisely in rebound phases within bearish trends.
The 15-minute chart: no clear direction
On M15, the value of ETH is practically stuck on the pivot (1,719.33), with an RSI at 51 and a MACD whose histogram is slightly negative (-0.8). The price is moving between the upper band (1,723) and the lower band (1,715) of the 15-minute Bollinger Bands — a compression that signals indecision. There is no clear actionable direction in the very short term. The bands are extremely tight compared to daily volatility and this often precedes a directional move, but the direction cannot be defined at this time.
Sentiment and the macro context do not help
The Fear & Greed Index is at 20 — Extreme Fear. This figure, derived from aggregated market data, is historically associated with phases of capitulation or deep accumulation, but it is not in itself a timing signal. Markets in extreme fear can remain in that condition for weeks. Bitcoin dominance at 56.65% suggests that crypto capital is concentrating on the benchmark asset, leaving altcoins — including Ethereum — in a position of relative weakness. The current price reflects this dynamic: there is no total capital flight, but neither is there rotation into ETH.
On the DeFi front, DefiLlama data show that Uniswap V3 fees have recorded +163% in the last 24 hours — an anomalous figure worth keeping an eye on. Spikes in activity on Ethereum DEXs can precede significant price moves, or simply reflect mechanical arbitrage. It is not a direct signal, but it is a contextual element indicating that the network is not dormant.
Bullish scenario: possible, but requires precise confirmations
For the ongoing bounce to become something more than a technical correction within a downtrend, Ethereum would need to hold 1,700 as support on an hourly basis and then manage to break and consolidate above $1,789 — the daily EMA20. That threshold is the first real test: if the price reaches it and fails to close convincingly above, the bounce ends there. A sustained break of 1,800 would open the way towards 1,965 (EMA50), which would be a significant recovery but still well within a medium-term bearish structure.
Level that invalidates the bullish scenario: a daily close below $1,467 (lower Bollinger band) would reopen much more severe weakness scenarios.
Bearish scenario: the one most consistent with the current structure
If the short-term bounce runs out — and the technical signals on H1 suggest that the remaining room is limited — the price of ETH could return to test the $1,640–1,650 area, an intraday support zone highlighted by the lower Bollinger band on H1 (1,639). A break of that level would push the price back towards 1,580–1,500, with the monthly pivot support and the daily lower band as reference. In a context of extreme fear and high BTC dominance, this scenario has strong narrative coherence.
Level that invalidates the bearish scenario: a convincing daily close above 1,789, with sustained volume, would scale back short-term bearish pressure.
How to read this moment
The current Ethereum price is in a phase where the timeframes speak different languages, and this is perhaps the most important point. The daily says: compromised structure, no reversal in sight. The hourly says: recovery underway, positive momentum. The 15-minute says: indecision, waiting. When three timeframes give three different answers, entry risk is high in both directions.
False signals are the main danger in this context: a breakout on M15 that looks promising can quickly reverse as soon as the price encounters resistance from the daily moving averages. Those trading the short term must be aware that they are swimming against the main current. Those thinking in the medium term, on the other hand, still do not have the signals that would justify a structurally long exposure — today’s technical picture shows an asset in a technical rebound, not in a reversal.
FAQ
What phase is Ethereum in right now?
On the daily, Ethereum is in a structurally bearish phase: the price is below all the key exponential moving averages and the RSI at 37.35 confirms a condition of weakness that has not yet been exhausted. The bounce visible on the hourly is a short-term technical recovery, not a reversal signal.
What is the most important level to monitor?
The resistance at $1,789, corresponding to the daily EMA20, represents the first real test for any recovery attempt. A daily close above this threshold, with sustained volume, would scale back short-term bearish pressure. On the downside, the critical support is at $1,467, the lower Bollinger band on the daily.
Is the bounce on the hourly a reversal signal?
No. The bounce on H1 shows positive momentum with RSI at 67.57, but this value near 70 rather signals an exhaustion of the bullish push. Moreover, the price has not yet reclaimed any structurally significant level on the daily. It is a technical move within a dominant bearish trend.
{“@context”:”https://schema.org”,”@type”:”FAQPage”,”mainEntity”:[{“@type”:”Question”,”name”:”What phase is Ethereum in right now?”,”acceptedAnswer”:{“@type”:”Answer”,”text”:”On the daily, Ethereum is in a structurally bearish phase: the price is below all the key exponential moving averages and the RSI at 37.35 confirms a condition of weakness that has not yet been exhausted. The bounce visible on the hourly is a short-term technical recovery, not a reversal signal.”}},{“@type”:”Question”,”name”:”What is the most important level to monitor?”,”acceptedAnswer”:{“@type”:”Answer”,”text”:”The resistance at $1,789, corresponding to the daily EMA20, represents the first real test for any recovery attempt. A daily close above this threshold, with sustained volume, would scale back short-term bearish pressure. On the downside, the critical support is at $1,467, the lower Bollinger band on the daily.”}},{“@type”:”Question”,”name”:”Is the bounce on the hourly a reversal signal?”,”acceptedAnswer”:{“@type”:”Answer”,”text”:”No. The bounce on H1 shows positive momentum with RSI at 67.57, but this value near 70 rather signals an exhaustion of the bullish push. Moreover, the price has not yet reclaimed any structurally significant level on the daily. It is a technical move within a dominant bearish trend.”}}]}
Disclaimer: This article is for informational purposes only and does not constitute financial advice, investment recommendation or a solicitation to buy or sell financial instruments or cryptocurrencies. The analyses do not guarantee future results. Investments in crypto-assets and financial markets involve a high risk of capital loss. Always do your own research (DYOR) and consult a qualified financial advisor before making any decision.
Content created with the assistance of artificial intelligence and human editorial review.


You May Also Like

Ripple (XRP) vs Solana (SOL): Which Altcoin Has Greater Potential in Q2 2026?

Kaiko Highlights Wrapped BTC Market Dynamics — What’s Next for Investors?

Fed Governor Calls For Strong Stablecoin Oversight As CLARITY Act’s Final Text Gets Delayed


