

Union Pacific Stock’s Operating Margin Story: What Q1 2026 Numbers Say About a $424 Target
Key Takeaways for Union Pacific Stock
- Union Pacific reported Q1 2026 total revenue of $6.22 billion, up 3% year over year.
- Adjusted EPS of $2.93 beat Street estimates of $2.86 and grew 9% from the prior-year quarter.
- Operating margins held at 40%, supported by record first-quarter workforce productivity and a 5% smaller headcount.
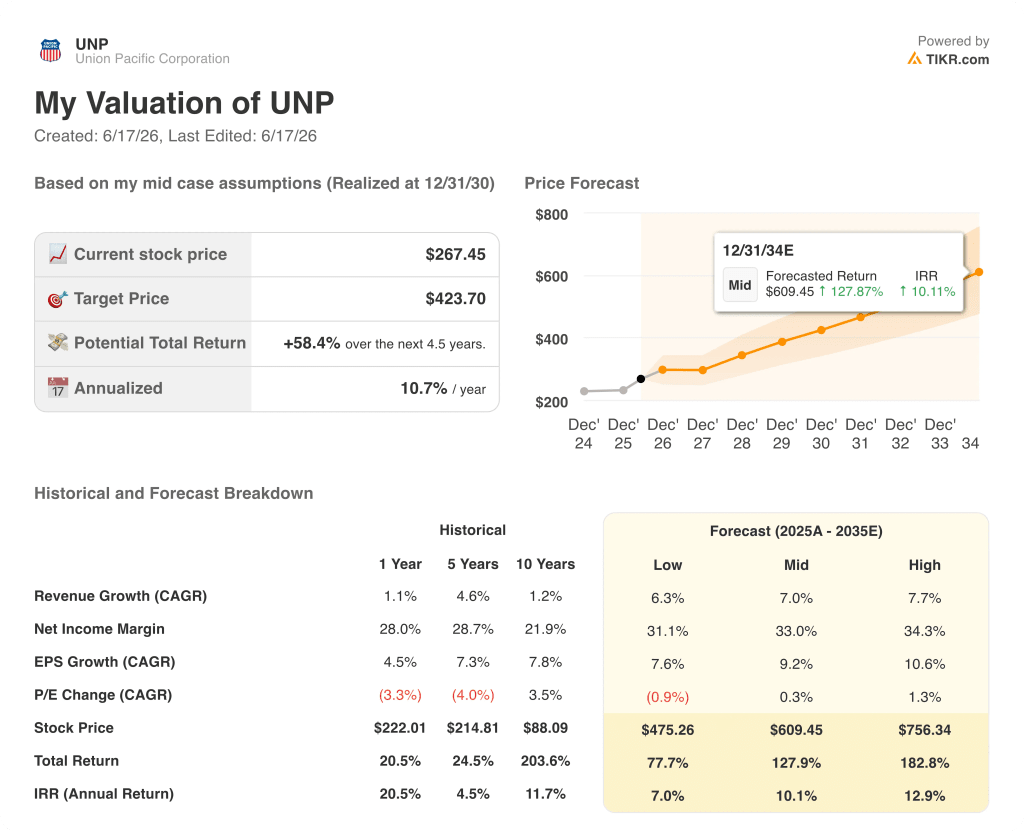
- TIKR’s model values Union Pacific at approximately $424 by December 2030, implying around 58% total return from the current price.
Dig into Q1 2026 earnings on TIKR and see exactly how operating leverage is building beneath Union Pacific’s headline beat. Explore UNP financials on TIKR for free →
Union Pacific Posts Record Q1 Results as Precision Railroading Compounds Its Edge
 UNP Stock Q1 2026 Earnings in USD (TIKR)
Union Pacific Corporation (UNP) delivered record first-quarter operating income and net income following its Q1 2026 earnings call on April 23, as CEO Jim Vena’s precision railroading model produced its sharpest efficiency metrics yet.
Revenue of $6.22 billion grew 3% year over year, driven by a 4% increase in freight revenue on 1% lower volume, meaning pricing power and mix did the heavy lifting.
Freight car velocity hit 235 miles per day, a first-quarter record, supported by terminal dwell of 19.7 hours.
CEO Vena put the network’s capacity advantage plainly: “We are running more business today than we did in 2019, and we’re running 24% less trains.”
The Bulk segment, which includes coal and grain, led volume growth at 12% for the quarter, with grain exports to China recovering strongly and a new business win with LCRA supporting coal demand.
Premium volumes declined 9% on weak international intermodal, but domestic intermodal delivered its third consecutive record quarter on service gains and over-the-road conversions.
Looking ahead, management affirmed its full-year outlook for mid-single-digit EPS growth and further operating ratio improvement, even as fuel costs running above $4 per gallon add pressure in Q2.
Union Pacific’s Q1 story is operating leverage in motion. Pull the income statement on TIKR to track how efficiency gains are translating to the bottom line quarter by quarter. Track UNP earnings data on TIKR for free →
UNP’s Operating Margin Held Above 40% While Headcount Shrank 5%
 UNP Stock Quarterly Financials (TIKR)
Union Pacific’s Q1 2026 operating income reached $2.46 billion, growing 3% year over year.
Operating margins came in at 40%, consistent with the range the company has maintained across the last eight quarters of income statement data.
Gross profit reached $3.46 billion, supported by a gross margin of 56%.
Total operating expenses increased to $1.00 billion in the quarter, rising from $0.97 billion in Q1 2025 as merger-related costs added noise to the cost structure.
The critical dynamic is the gap between gross margin stability and operating expense discipline: gross margins have held within a narrow band around 56% across the past eight quarters, while workforce productivity improved 7% in Q1 alone.
UNP Leads CSX and NSC on Operating Margins, and the Gap Has Only Widened
 UNP Stock Operating Margins vs CSX Stock and NSC Stock (TIKR)
Union Pacific has held operating margins above 39% in every quarter shown, while CSX Corporation (CSX) peaked at 37% and has compressed to 36% in the most recent quarter.
Norfolk Southern’s (NSC) margin story is more severe: after a spike to 50% in Q3 2024, NSC has declined to 31% as of Q1 2026, now trailing Union Pacific by 8 percentage points.
The spread between UNP and NSC has widened from 3 points in Q2 2024 to 8 points in Q1 2026, a trajectory that makes Union Pacific’s precision railroading advantage look structural rather than cyclical.
CSX has maintained a narrower but persistent gap below UNP, running 3 to 4 points behind across every quarter in the dataset.
What makes Union Pacific’s position particularly durable is that its margin floor has held at 40% across the last four quarters even as peers compressed, which is exactly the operating discipline the TIKR target depends on continuing.
Is Union Pacific Stock Undervalued? TIKR’s $424 Target Points to 58% Upside
TIKR’s model values Union Pacific at approximately $424 by December 2030, implying around 58% total return from the current price of $267, or roughly 11% per year.
The case for that target rests on whether operating margins can continue compounding from their current 40% base as revenue recovers and merger-related costs eventually roll off.
Union Pacific’s gross margin stability above 56% over the past eight quarters provides the floor: the business is structurally profitable at the gross level, and any incremental revenue flows through an already-lean cost structure.
The condition that has to hold is that workforce productivity gains, which reduced headcount 5% while volume held flat, continue to offset labor cost inflation running 4% to 5% per employee annually.
 UNP Stock Valuation Model Results (TIKR)
The ongoing Norfolk Southern merger application adds optionality the income statement alone doesn’t capture, but TIKR’s base case target requires none of it.
Explore the full TIKR model for UNP and stress-test the operating margin assumptions behind the $424 target yourself. Build your own UNP valuation model on TIKR for free →
Should You Invest in Union Pacific Corporation?
The only way to really know is to look at the numbers yourself. TIKR gives you free access to the same institutional-quality financial data that professional analysts use to answer exactly that question.
Pull up Union Pacific Corporation stock and you’ll see years of historical financials, what Wall Street analysts expect for revenue and earnings in the quarters ahead, how valuation multiples have moved over time, and whether price targets are trending up or down.
You can build a free watchlist to track Union Pacific Corporation alongside every other stock on your radar. No credit card required. Just the data you need to decide for yourself.
Access Professional Tools to Analyze UNP stock on TIKR for Free →


You May Also Like

3 Beaten-Down Stocks That Could Roar Back in June

First Iranian Oil Moves Past US Blockade Ahead Of Deal Signing

3 Stocks That Have Made Long-Term Investors Rich (and Could Do It Again)


