

Our Highest Conviction Call on Realty Income Points to 30% Upside
The post Our Highest Conviction Call on Realty Income Points to 30% Upside appeared first on 24/7 Wall St..
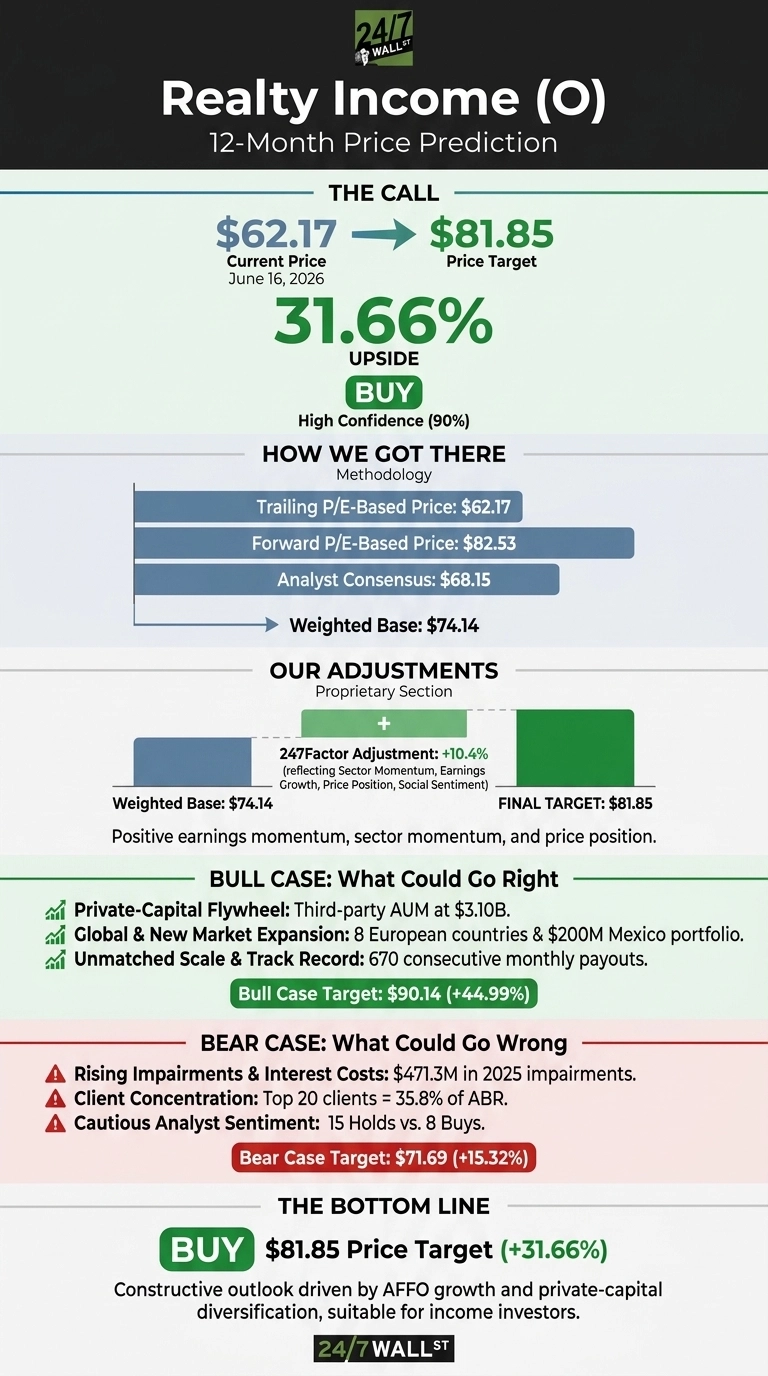
Our Realty Income (NYSE:O) call is constructive. The 24/7 Wall St. price target for Realty Income is $81.85, implying 31.66% upside from the $62.17 close on June 16, 2026. We rate the stock a buy with a 90% confidence level, which qualifies as high conviction inside our framework.
 24/7 Wall St.
24/7 Wall St. Price Target Summary
| Metric | Value |
|---|---|
| Current Price | $62.17 |
| 24/7 Wall St. Price Target | $81.85 |
| Upside | 31.66% |
| Recommendation | BUY |
| Confidence Level | 90% |
A Net Lease Giant Quietly Reaccelerating
Realty Income, branded as The Monthly Dividend Company, has woken up in 2026. Shares are up 12.68% year to date and 14.34% over the past year, trading roughly 2% below the 52-week high of $67.05 and well above the $53.32 low.
The Q1 2026 earnings report landed clean: AFFO per share of $1.13 rose 6.6% year over year, revenue hit $1.548 billion, and portfolio occupancy held at 98.9% with a 103.4% rent recapture rate.
Management raised 2026 AFFO guidance to $4.41 to $4.44 and lifted investment volume guidance to $9.5 billion from $8 billion, deploying capital at a 7.1% initial cash yield.
New private-capital vehicles, including the $1 billion Apollo joint venture and the $1.7 billion U.S. Core Plus cornerstone raise, are reshaping how Realty Income funds growth.
The Case for $90 and Higher
Our bull case puts Realty Income at $90.14 one year out, a 44.99% total return. The catalysts are tangible. First, the private-capital flywheel. With third-party AUM at $3.10 billion and fee-earning equity of $1.331 billion, Realty Income is layering capital-light fee streams onto a stable rent base.
Second, global expansion across eight European countries beyond the U.K., plus a new $200M Mexican industrial portfolio, widens the addressable opportunity.
Third, dividend credibility: 114 consecutive quarterly increases and 670 monthly payouts support the 5.04% yield. CEO Sumit Roy said the raised outlook is “a testament to the unmatched scale, track record and operating capabilities of our global net lease enterprise.”
The Risks Worth Watching
The bear case lands at $71.69, still a 15.32% return. The headwinds are real. Q1 2026 carried $129.3 million in impairment provisions, and full-year 2025 impairments totaled $471.3 million. Interest expense climbed to $1.13 billion in 2025 from $1.02 billion.
The top 20 clients account for 35.8% of annualized base rent, and reported P/E sits at a heady 55x. GAAP earnings understate cash power because real estate impairments are non-cash, and AFFO, the metric management and the dividend run on, grew 6.6%. Analyst sentiment skews cautious with 15 Holds against 8 Buys.
Realty Income Price Prediction 2026-2030
Our 24/7 Wall St. price target for Realty Income is $81.85 with a buy rating and 90% confidence. The tipping factor is the AFFO trajectory paired with a private-capital strategy that diversifies funding away from equity issuance.
The setup looks constructive for investors seeking a sub-1 beta income compounder with credible mid-single-digit AFFO growth. The thesis weakens if long rates climb materially from here, since cap-rate sensitivity would compress the multiple.
| Year | 24/7 Wall St. Price Target |
|---|---|
| 2026 | $71.45 |
| 2027 | $83.02 |
| 2028 | $98.80 |
| 2029 | $114.00 |
| 2030 | $126.81 |
These projections assume Realty Income continues compounding AFFO at the guided pace and that the private-capital platform scales. Significant upside or downside could result from material moves in long-term interest rates or unexpected tenant credit deterioration in the top-20 client roster.
Act now: the analyst who called NVIDIA in 2010 just named his top 10 AI stocks — and Realty Income didn’t make the cut. Grab the names FREE today.
The post Our Highest Conviction Call on Realty Income Points to 30% Upside appeared first on 24/7 Wall St..


You May Also Like

Ethereum koers toont zeldzaam dubbel koopsignaal en richt zich op $4.550

UK Gilt Yields Spike As Burnham Win Opens Door To Oust Starmer

HashKey Capital’s Strategic $540K STO Deposit to Binance Reveals Institutional Crypto Moves Amid Market Turmoil


