

Bitcoin Breaks Down from Bearish Structure: Now Holding Below $63K
The Bitcoin price has fallen out of a bear flag/channel structure and is now holding below $63K. Are the bears completely in charge now, and could a new low be incoming?
Channel breakdown target below $60K
Source: TradingView
The short-term time frame reveals how the $BTC price has now crashed out of the bear flag structure, falling below the 100 SMA as it did so. We are still calling it a bear flag although the 3rd touch of the top trendline, in order to confirm the pattern, never materialised.
If we take the pattern as a channel, the measured move from the breakdown would take the price exactly down to the $59,600 horizontal level. This would probably be the last line of support before getting down to $57K and then the low $50Ks.
If on the other hand the bulls are going to push the price back up, perhaps to confirm the bottom of the bear flag, this will likely be signalled by a cross up of the indicator line through the descending trendline in the Relative Strength Index.
An accelerated slide once major supports fail?
Source: TradingView
The daily chart is showing that another bearish structure is likely to push the $BTC price down further. The bull market trendline is going to have to act as strong support. Once the price takes hold beneath it, an accelerated slide to the downside could take place. The bear market trendline could also play an important role of support if the price gets down to it.
Enveloping weekly candle to spark a crash through major supports?
Source: TradingView
The weekly chart probably gives us the best perspective on what may happen over these next few weeks. From the bulls’ point of view, holding the 200-week SMA is a big plus. The bull market trendline is also just below if more support is needed.
However, the bear case does look more convincing. With three days left in the week the current weekly candle is enveloping the previous weekly candle. If this is still the case at the end of Sunday, there is a likelihood that the next candle will also be red and will crash through supports and will make a new lower low on its way down towards $50K.
Disclaimer: This article is provided for informational purposes only. It is not offered or intended to be used as legal, tax, investment, financial, or other advice.


You May Also Like
Japanese Yen Recovers Ground as US Dollar Rally Loses Steam Despite Hawkish Fed
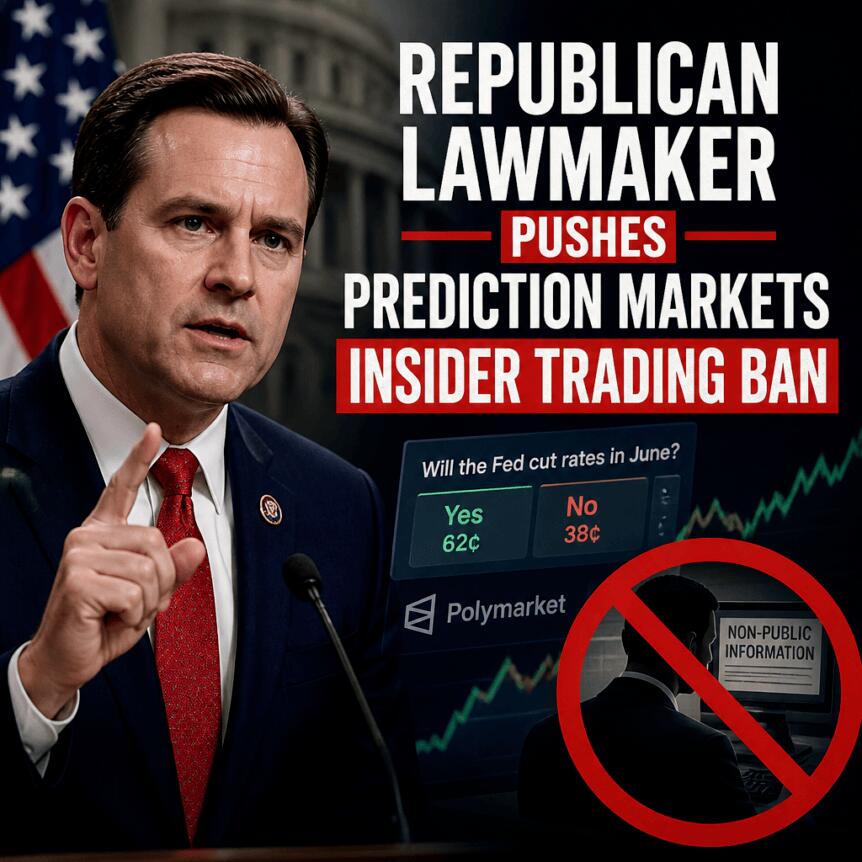
Republican Lawmaker Pushes Prediction Markets Insider Trading Ban

Charles Schwab Enters Prediction Markets With S&P 500 Event-Based Options


