

Verizon Just Tore Up Its Pricing Playbook. Where VZ Stock Could Go in 2026
Key Stats for Verizon Stock
- Current Price: $45.36
- Target Price (Mid): ~$70
- Street Target: ~$52
- Potential Total Return: ~54%
- Annualized IRR: ~10% / year
- Earnings Reaction: +0.30% (April 27, 2026)
Now Live: Discover how much upside your favorite stocks could have using TIKR’s new Valuation Model (It’s free) >>>
What Happened?
Verizon Communications Inc. (VZ) has spent years asking investors to wait, and the market is still deciding whether the wait is worth it. The stock closed at $45.36 on June 22, near the bottom of its 52-week range of $38.39 to $51.68, even as the company posts its best operating numbers in years. That gap is the story for Verizon stock in 2026.
The disagreement is sharp. Bulls see a turnaround finally producing results, backed by a 6.3% dividend yield. Bears see $192 billion in net debt and a wireless market where every subscriber is fought over. The question neither side can answer yet is whether customers will actually stay. On June 16, Verizon made its boldest move yet to find out.
The Reboot That Backs Up the Churn Thesis
Verizon scrapped activation and upgrade fees and launched its first company-wide loyalty program, alongside a stripped-down plan called Simplicity. As laid out in the company’s customer-first announcement, Simplicity offers Verizon’s full 5G network with no tiers at $45 a month, or $30 for switchers, while Verizon One bundles mobile and home internet on one $70 bill. Verizon says the changes should lift revenue and EBITDA and keep churn falling, with no change to 2026 guidance.
This is the value-proposition refresh management promised for early 2026, now live. It serves the one metric CEO Dan Schulman puts above all others. At the J.P. Morgan Technology, Media and Communications Conference on May 18, he was blunt about why.
“Churn is really the one metric that I think unleashes our entire business model,” said Daniel Schulman, CEO of Verizon. Every fee removed and perk added is aimed at keeping customers from leaving.
The early data backs him up. Schulman walked through the trajectory: Consumer churn, the rate at which customers cancel service, ran 95 basis points in Q4, improved to 90 in Q1, and exited the quarter at 85. He tied that to a 35% drop in acquisition and retention costs from the Q4 peak. For a company that just returned to postpaid phone growth after more than a decade, that line is proof that the strategy works.
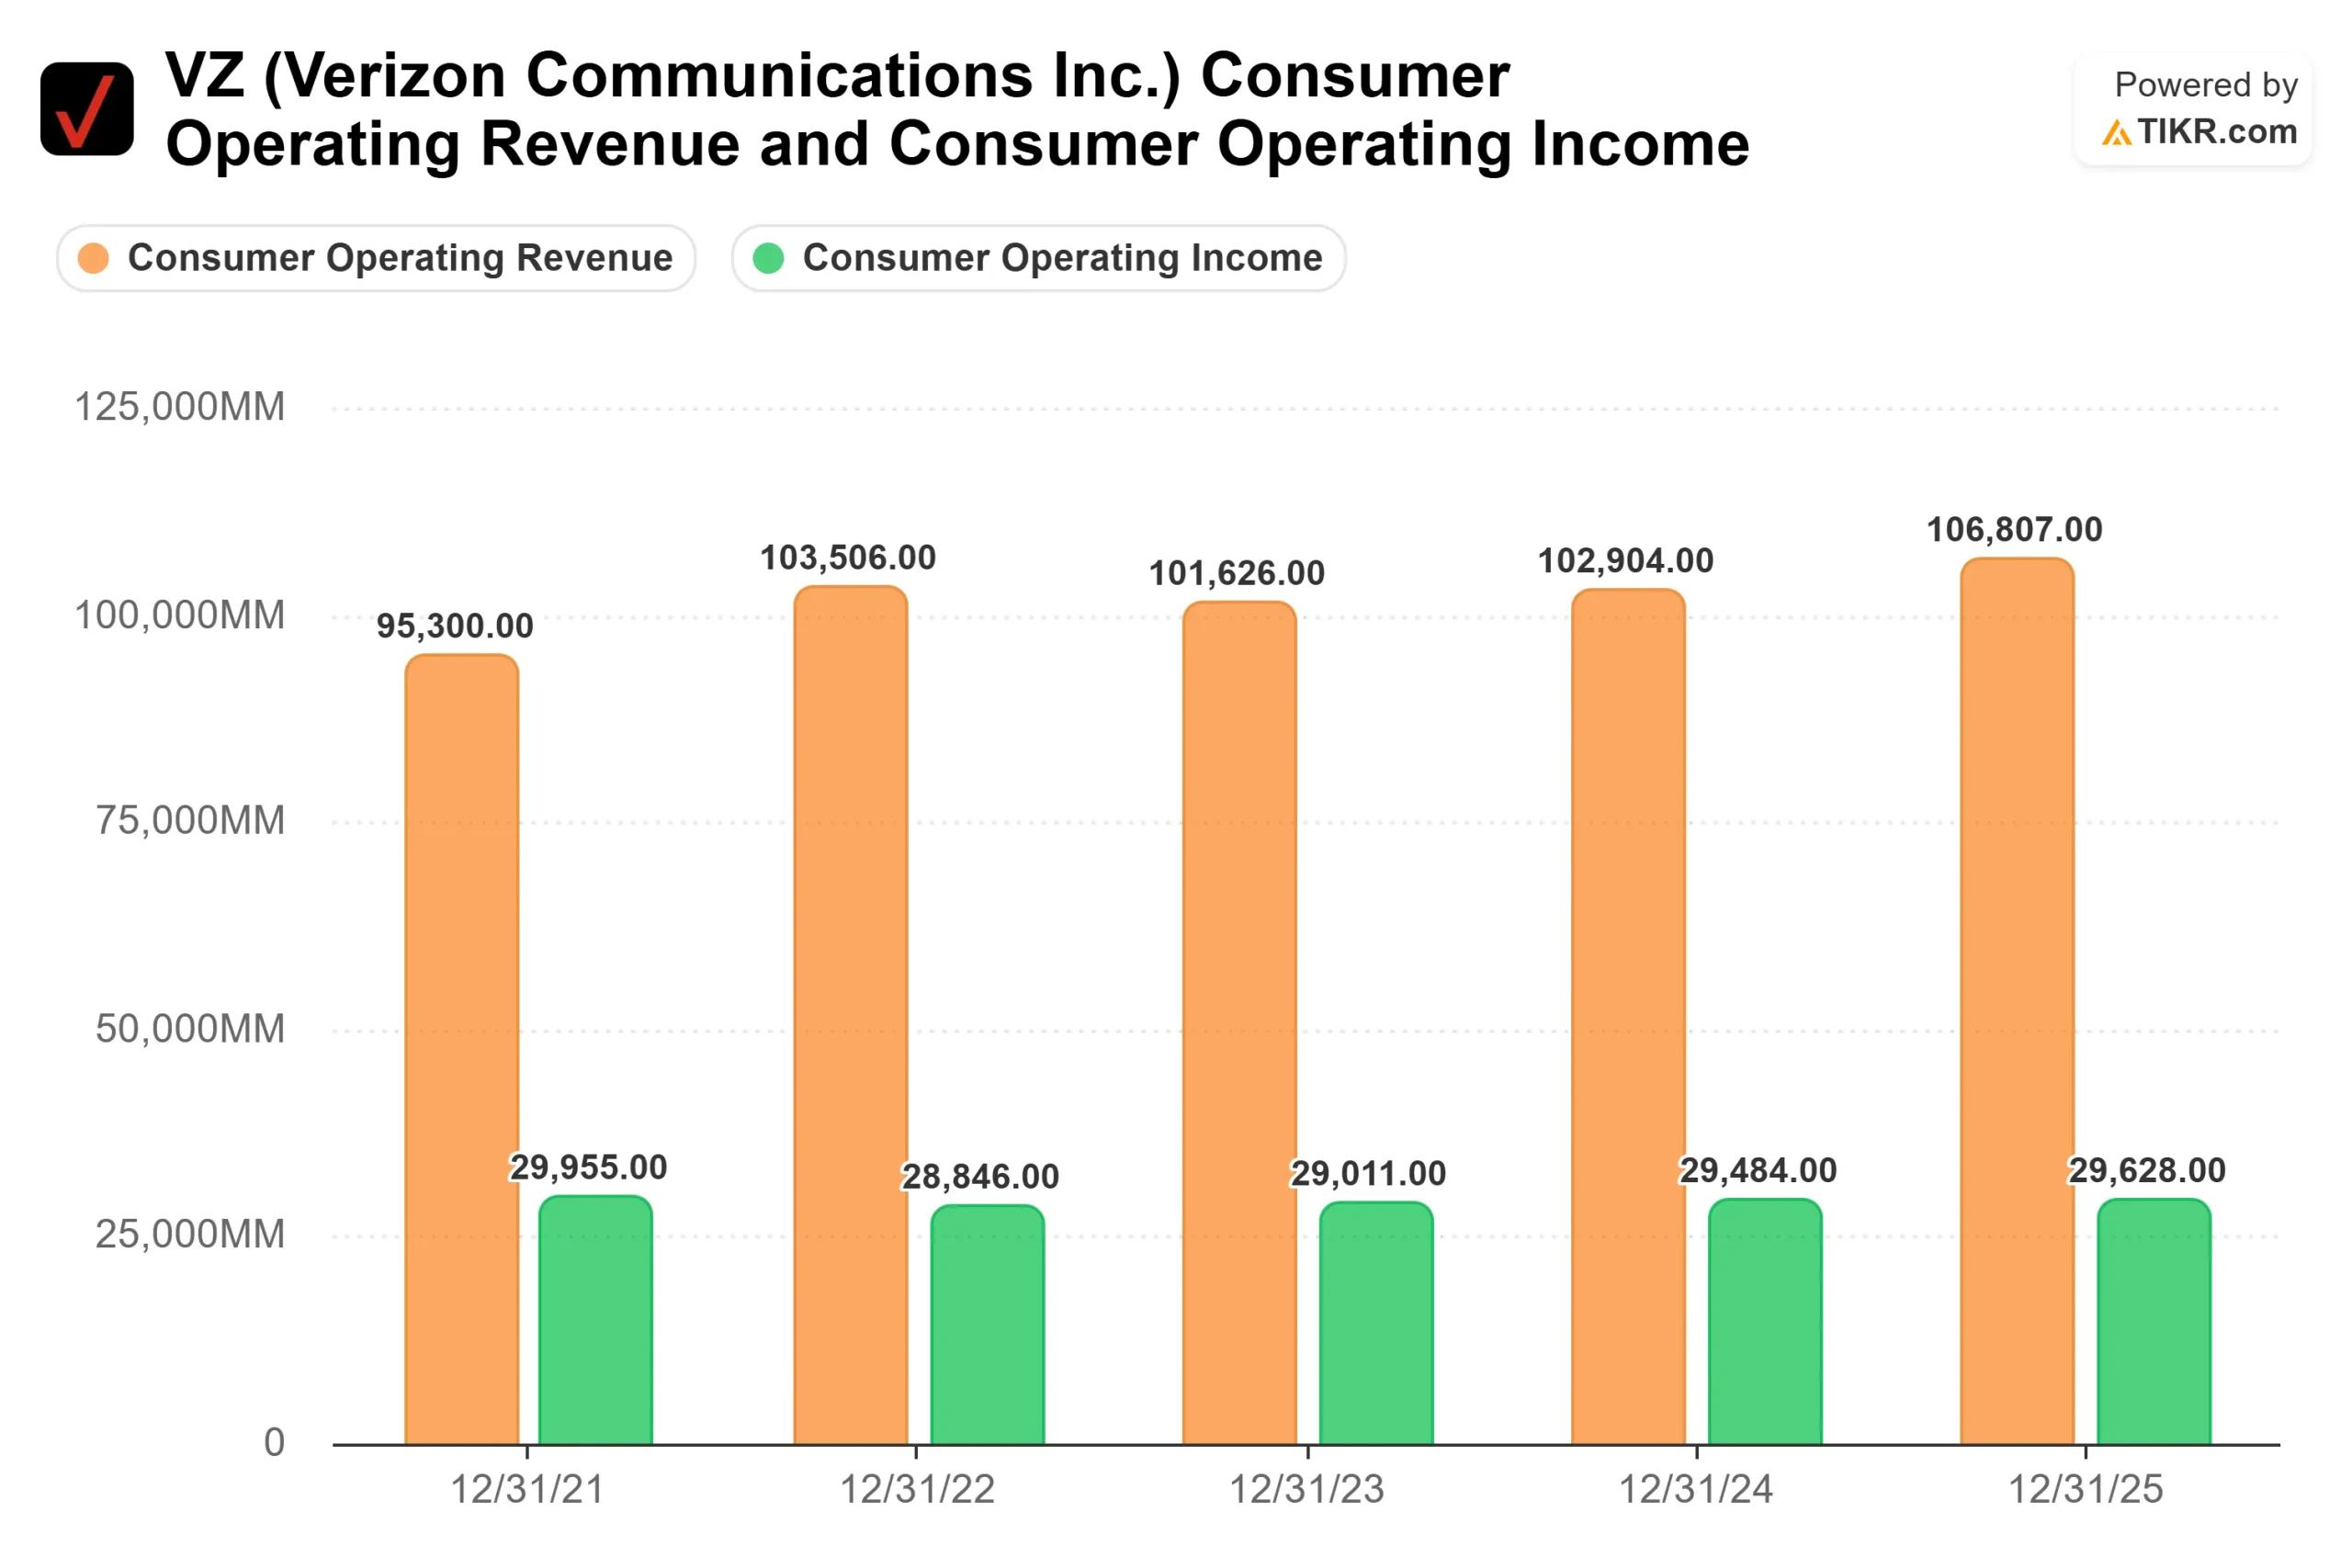 Verizon Consumer Operating Revenue & Operating Income (TIKR)
See historical and forward estimates for Verizon stock (It’s free!) >>>
A Regulatory Bruise, and the Debt Question
Not every headline has helped. On June 4, Verizon and AT&T shares fell about 4% after the Supreme Court ruled 8-1 for the FCC, upholding its power to assess fines without a jury trial in a case tied to roughly $47 million in penalties against Verizon over customer location data. The fine is immaterial; the reminder that regulatory risk lingers is not.
The heavier weight is leverage. With net debt of $192 billion and net debt to EBITDA at 3.37x, free cash flow must be split between debt paydown, the dividend, and buybacks for several more quarters. That is the constraint bears keep circling.
Why the Stock Still Looks Cheap
Verizon trades at roughly 9x next-twelve-months earnings and 7.1x NTM EV/EBITDA, with a 6.3% yield on a 66.5% payout. On the J.P. Morgan stage, Schulman said free cash flow and adjusted EPS growth had both run near negative 1% over the past five years, and that 2026 guidance now calls for at least 7% free cash flow growth and 5% to 6% adjusted EPS growth. That step-up is not yet in the multiple.
The peer math sharpens it. AT&T trades at about 6.6x NTM EV/EBITDA and Comcast at 4.9x, against Verizon at 7.1x. Verizon’s slight premium reflects scale and a network Schulman says leads on 7 of 8 external benchmarks. The more telling gap is against its own history: the forward earnings multiple has slipped toward 9x even as results improved.
The risk runs the other way. If Simplicity sparks a price war or churn stalls, the margin recovery underpinning the bull case erodes fast. Schulman flagged the near-term drag himself, roughly 190 basis points of promotional amortization and a pricing pause that only laps in the third quarter. The setup is asymmetric, not risk-free.
 Verizon NTM EV/EBITDA (TIKR)
See how Verizon performs against its peers in TIKR (It’s free!) >>>
TIKR Advanced Model Analysis
- Current Price: $45.36
- Target Price (Mid): ~$70
- Potential Total Return: ~54%
- Annualized IRR: ~10% / year
 Verizon Advanced Valuation Model (TIKR)
See analysts’ growth forecasts and price targets for Verizon stock (It’s free!) >>>
The mid-case scenario points to around $70 by December 2030, roughly 54% total return, or about 10% a year. The mid case is the right anchor because it tracks management’s own guidance rather than a bull or bear extreme.
The model’s engine is efficiency, not growth. Revenue is assumed to rise only about 2% a year, with the real lift coming from the $5 billion operating-expense program pushing net income margin toward roughly 16%. The two revenue contributors are broadband growth across the combined Frontier and Fios fiber base and a wireless service revenue recovery as churn improves. The primary risk is competitive intensity: a promotional response from AT&T or T-Mobile could compress margins before the savings fully land.
Upside means churn keeps falling, bundles compound, and the multiple re-rates toward its historical norm. Downside means a price war and leverage caps the stock near today’s 9x, leaving investors with little beyond the dividend.
Conclusion
Watch Consumer churn when Verizon reports Q2 2026 in late July. Schulman exited Q1 at 85 basis points and staked the turnaround on that line’s direction. Good looks like churn holding at or below 85, with postpaid phone net adds still positive, the first sign Simplicity is winning customers rather than just discounting to them. Bad looks like churn drifting back toward 90 as the new plans pull in existing customers without enough switchers. One quarter will not settle it, but it will show whether the most expensive promise in this turnaround, that customers finally stay, is one Verizon can keep.
See what stocks billionaire investors are buying so you can follow the smart money with TIKR.
Should You Invest in Verizon?
The only way to really know is to look at the numbers yourself. TIKR gives you free access to the same institutional-quality financial data that professional analysts use to answer exactly that question.
Pull up Verizon, and you’ll see years of historical financials, what Wall Street analysts expect for revenue and earnings in the quarters ahead, how valuation multiples have moved over time, and whether price targets are trending up or down.
You can build a free watchlist to track Verizon alongside every other stock on your radar. No credit card required. Just the data you need to decide for yourself.
Analyze Verizon on TIKR Free →
Looking for New Opportunities?
- See what stocks billionaire investors are buying so you can follow the smart money.
- Analyze stocks in as little as 5 minutes with TIKR’s all-in-one, easy-to-use platform.
- The more rocks you overturn… the more opportunities you’ll uncover. Search 100K+ global stocks, global top investor holdings, and more with TIKR.
Disclaimer:
Please note that the articles on TIKR are not intended to serve as investment or financial advice from TIKR or our content team, nor are they recommendations to buy or sell any stocks. We create our content based on TIKR Terminal’s investment data and analysts’ estimates. Our analysis might not include recent company news or important updates. TIKR has no position in any stocks mentioned. Thank you for reading, and happy investing!


You May Also Like

Critical USDT0 Response to Drift Hack Exposes Stark Contrast in Stablecoin Security Protocols

China Nabs Another Huione Group Core Member in Cambodia Extradition

Token Surpasses $1.14 After Stunning 367% Rally


