

Bitcoin Price Analysis: BTC Falls to $62K as Bears Target Key Support Levels
As of June 23, 2026, Bitcoin (BTC) is experiencing a period of consolidation and bearish sentiment across various technical indicators. The cryptocurrency market continues to navigate macroeconomic uncertainties, influencing investor behavior and price movements. This analysis delves into key technical indicators to provide a comprehensive overview of Bitcoin’s current market position and potential short-term trajectories.
Technical Overview
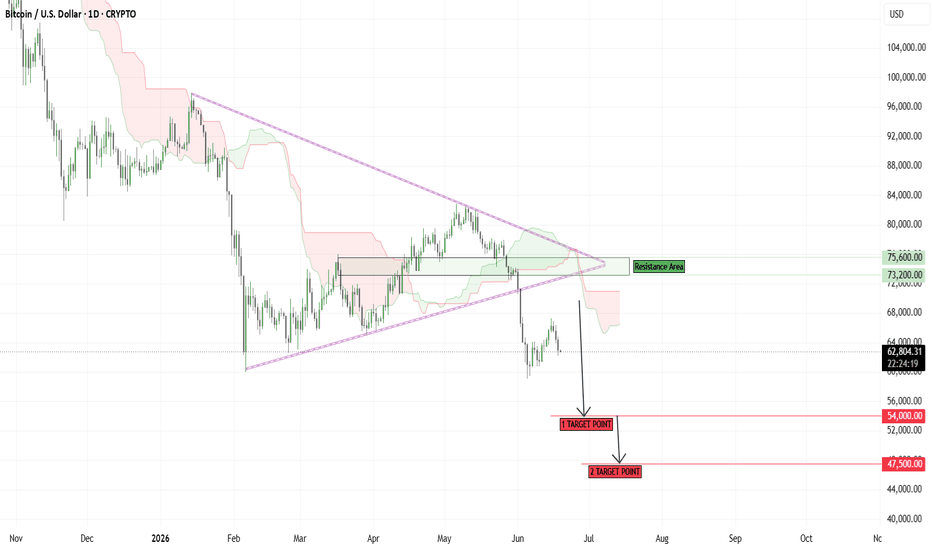 Bitcoin Price Chart – June 23, 2026
Moving Averages (EMA & SMA)
Moving Averages are fundamental tools for identifying trend direction. A consistent theme across both Exponential Moving Averages (EMA) and Simple Moving Averages (SMA) for Bitcoin on June 23 is a strong sell signal. All listed EMAs and SMAs, ranging from 10-day to 200-day periods, are currently above Bitcoin’s price, indicating a prevailing downtrend. The 200 EMA, often considered a significant long-term trend indicator, stands at 77,533, substantially higher than the current price, reinforcing the long-term bearish outlook. This suggests that Bitcoin is trading well below its key moving average levels, confirming a bearish trend. Notably, the current weakness follows Bitcoin’s move below $67,000 on June 3, a development that reinforced bearish sentiment and increased selling pressure across the market.
Relative Strength Index (RSI)
The Relative Strength Index (RSI) is a momentum oscillator that measures the speed and change of price movements. With an RSI (14) value of 36, Bitcoin is currently in a neutral zone. While not yet in oversold territory (typically below 30), the low neutral reading suggests weakening momentum and a lack of strong buying pressure. This aligns with the broader bearish sentiment indicated by the moving averages, implying that while a sharp decline might not be imminent based on RSI alone, there is little to suggest an immediate bullish reversal.
MACD (Moving Average Convergence Divergence)
The MACD is a trend-following momentum indicator that shows the relationship between two moving averages of a security’s price. The MACD Level (12, 26) is at -2,010, which surprisingly indicates a ‘Buy’ action according to the provided data. This could suggest a potential short-term bullish divergence or a signal that the downward momentum is decelerating, potentially hinting at a bounce. However, given the overall bearish context from other indicators, this signal should be interpreted with caution and confirmed by other factors.
Volume Analysis
Volume is crucial for confirming the strength of price movements. While specific volume data points like VWAP and Volume Profile are not provided in detail, the general ‘Volume’ indicator is essential for understanding market conviction. A low volume during price declines can indicate a lack of strong selling pressure, potentially leading to a reversal. Conversely, high volume during a decline confirms the bearish trend’s strength. Without specific figures, it is difficult to ascertain the strength of recent moves, but generally, sustained price movements on low volume are less reliable.
Support & Resistance / Price Action
Support and Resistance levels are critical for identifying potential entry and exit points. The current market environment follows a sharp sell-off earlier this month, when Bitcoin dropped 6.58% on June 4 and fell below the $63,000, reinforcing bearish sentiment across the cryptocurrency market. Based on the current price action around 62,300-62,400, Bitcoin is testing significant support levels. A breakdown below these levels could lead to further declines, while a successful defense could establish a base for a potential rebound. Given the strong sell signals from moving averages, resistance levels above the current price are likely to be formidable. Traders will be closely watching for clear price action signals around these critical junctures.
Conclusion
Bitcoin’s technical landscape on June 23, 2026, is predominantly bearish, as indicated by the overwhelming ‘Sell’ signals from various Moving Averages. The RSI is neutral but weak, suggesting a lack of upward momentum. The MACD’s ‘Buy’ signal presents a contrarian view, which might hint at a short-term relief rally or a deceleration of the downtrend, but it needs strong confirmation. Volume analysis and price action around key support and resistance levels will be crucial in determining Bitcoin’s immediate future. Investors should exercise caution and look for definitive signs of a trend reversal before making significant moves.


You May Also Like

Bitcoin World Reveals Top 5 Stunning Gainers And Losers

EUR/JPY Stalls: Critical 184.00 Level Holds as Markets Decipher ECB and BoJ Policy Signals

Token Surpasses $1.14 After Stunning 367% Rally


