

XRP Price: Binance Supply Hits 3-Month High as Selling Pressure Builds
TLDR
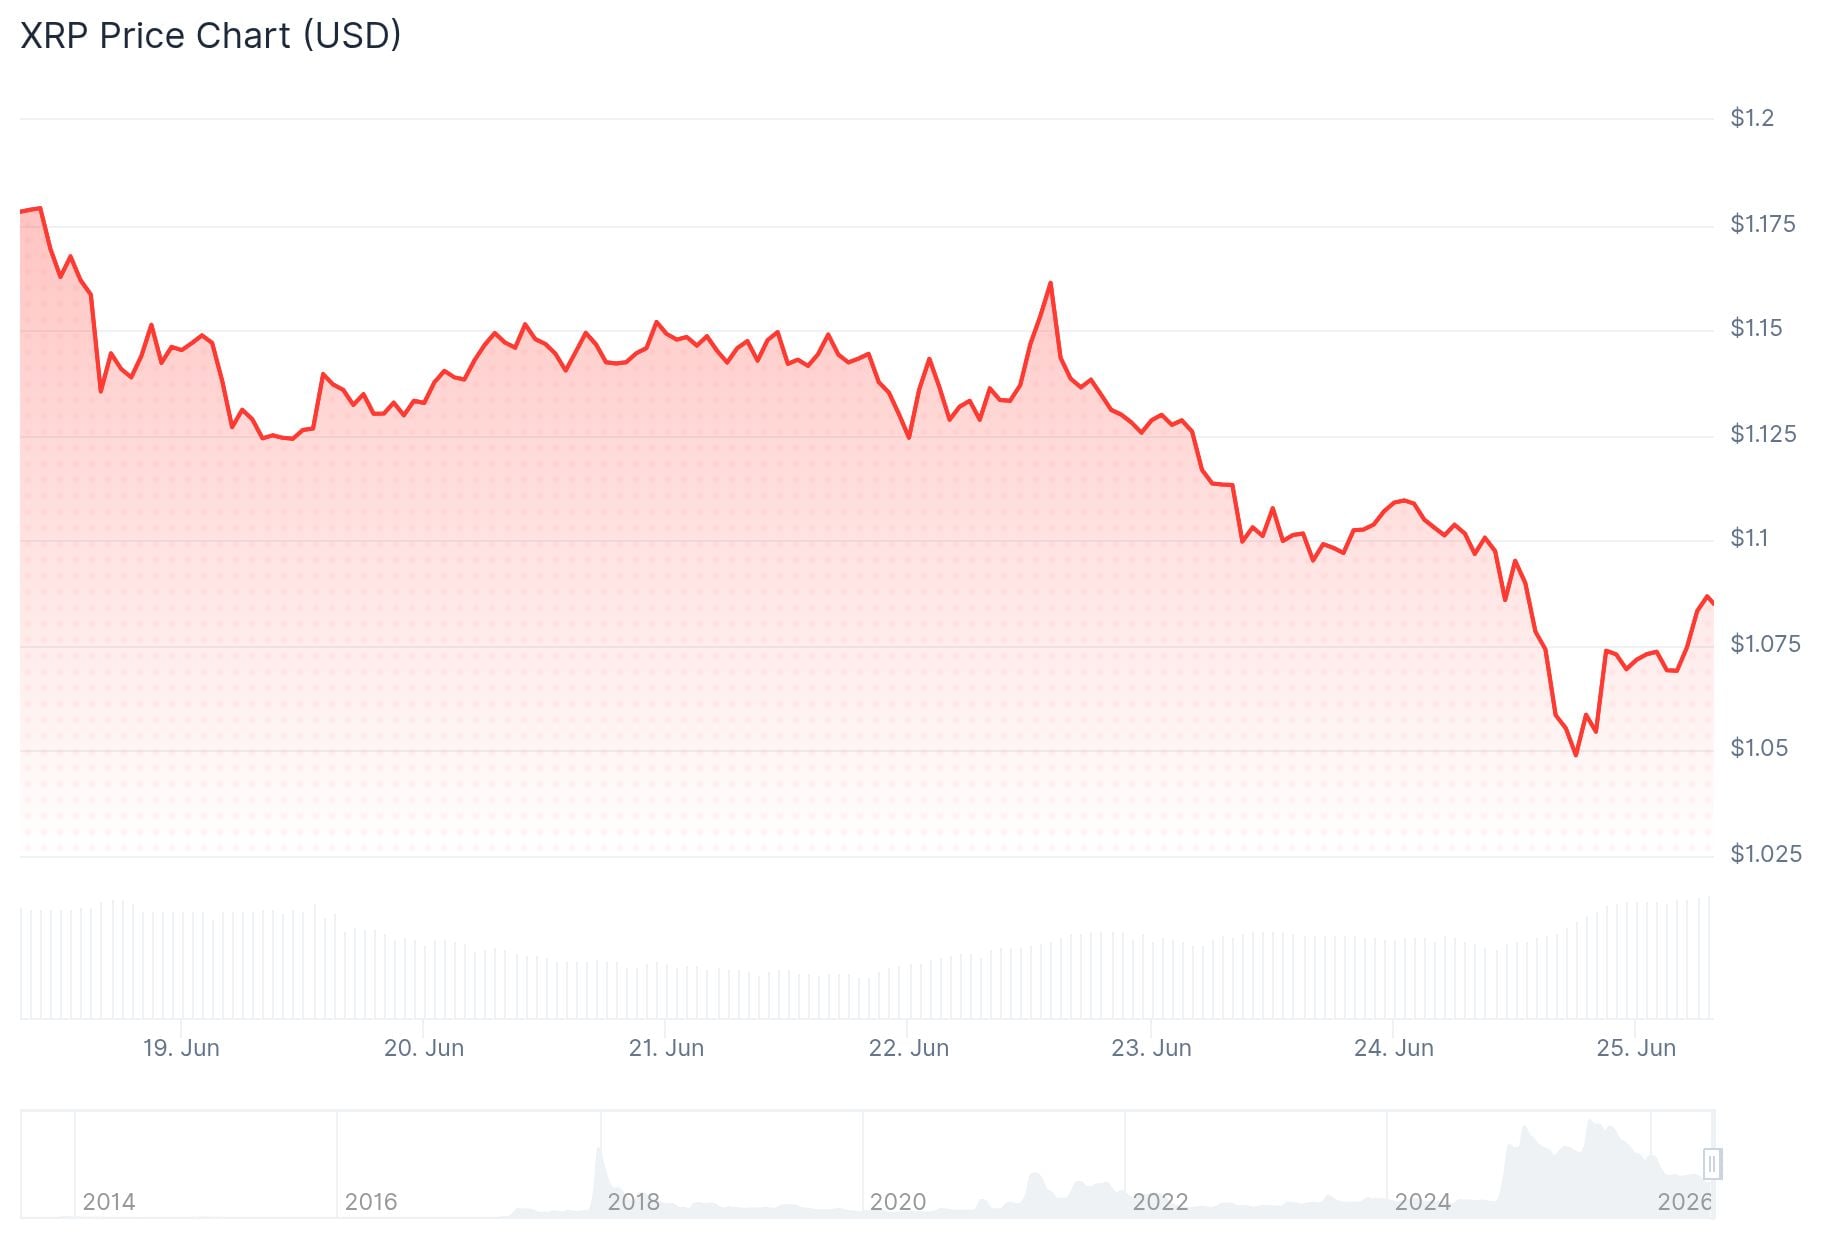
- XRP dropped to around $1.057, down over 15% from its June 16 peak near $1.29
- XRP supply on Binance hit a 3-month high, with the Scarcity Index falling to 0.34
- A falling wedge pattern on the 4-hour chart keeps a recovery scenario technically possible
- CoinGlass data shows a major liquidation cluster near $1.14 that could pull price higher
- $13.53 million in XRP derivatives were liquidated in 24 hours, with longs making up 96%
XRP has been under steady selling pressure since June 16, when it peaked near $1.29. By June 24, the token was trading around $1.057, a drop of more than 15% in just over a week.
 XRP Price
The sell-off came shortly after Ripple secured preliminary approval under Europe’s Markets in Crypto-Assets (MiCA) framework through Luxembourg. The approval grants passporting rights across the European Economic Area, but traders used the news as a chance to take profits rather than push prices higher.
Bitcoin also added to the pressure. It briefly fell below $62,000 during the same period, weakening sentiment across the broader crypto market. Elevated interest rates and a rotation of capital into AI and semiconductor stocks have kept speculative flows into digital assets limited throughout the second quarter.
Crypto analyst Altcoin Sherpa weighed in on X, saying the chart doesn’t look great on any time frame and that XRP could grind lower toward $0.75. That kind of bearish call from a well-followed analyst reflects the mood in the market right now.
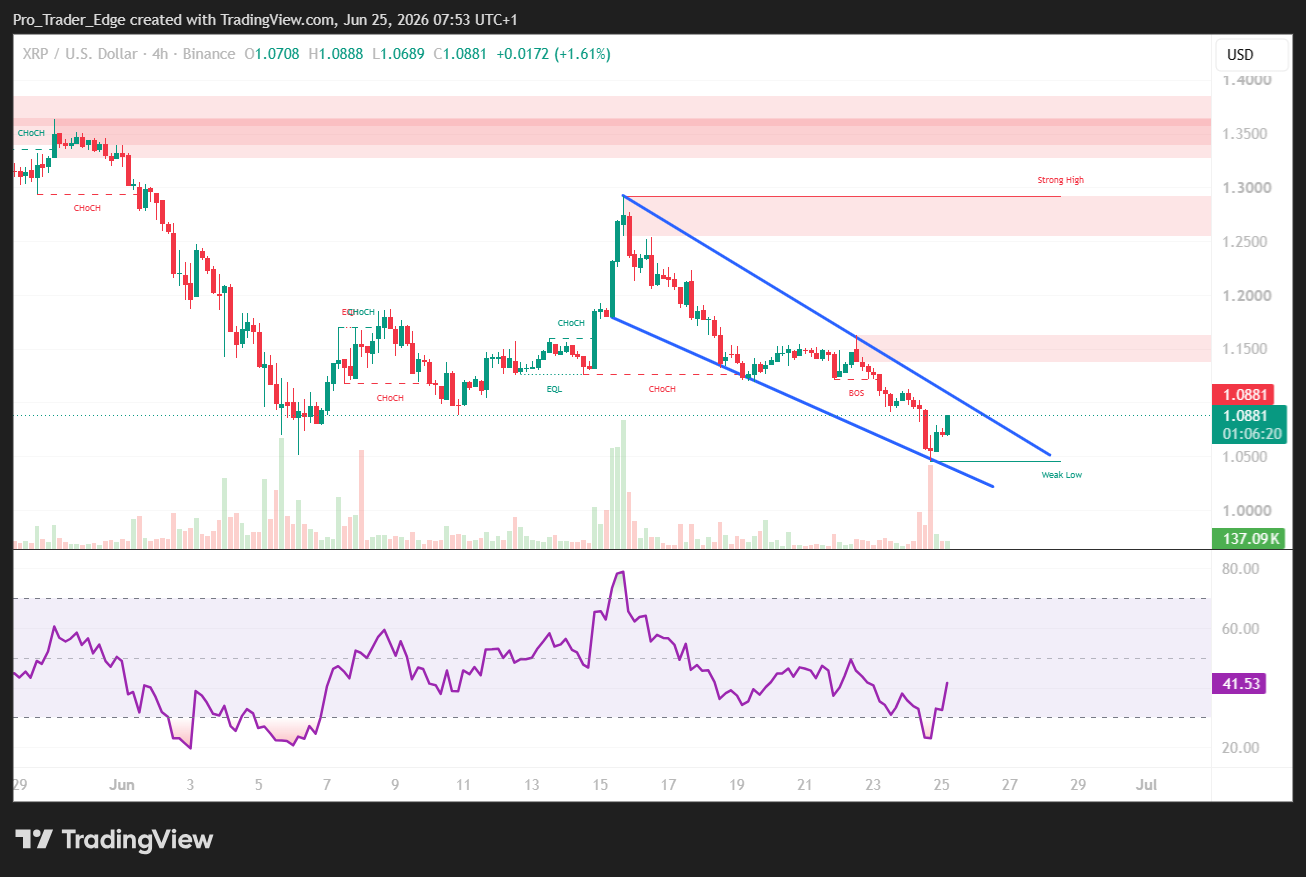
Falling Wedge Keeps Recovery In Play
The 4-hour chart shows XRP forming a falling wedge pattern since the June 16 high. This pattern features two converging downward trendlines and can precede a bullish reversal when selling momentum weakens.
 Source: TradingView
Price has reached the lower boundary of the wedge near $1.08, which also lines up with a Fibonacci support zone. A breakout above the upper trendline could open up resistance levels at $1.13, $1.16, and $1.19.
Momentum indicators are mixed. The 4-hour MACD remains below zero, showing sellers still have short-term control. However, the histogram has started to flatten, suggesting downside momentum may be slowing. Chaikin Money Flow sits at around -0.13, showing capital is still leaving the market.
On the daily chart, XRP remains below Supertrend resistance near $1.24 and under a sequence of lower highs since mid-May. The daily RSI is near 36, approaching oversold territory but not yet there.
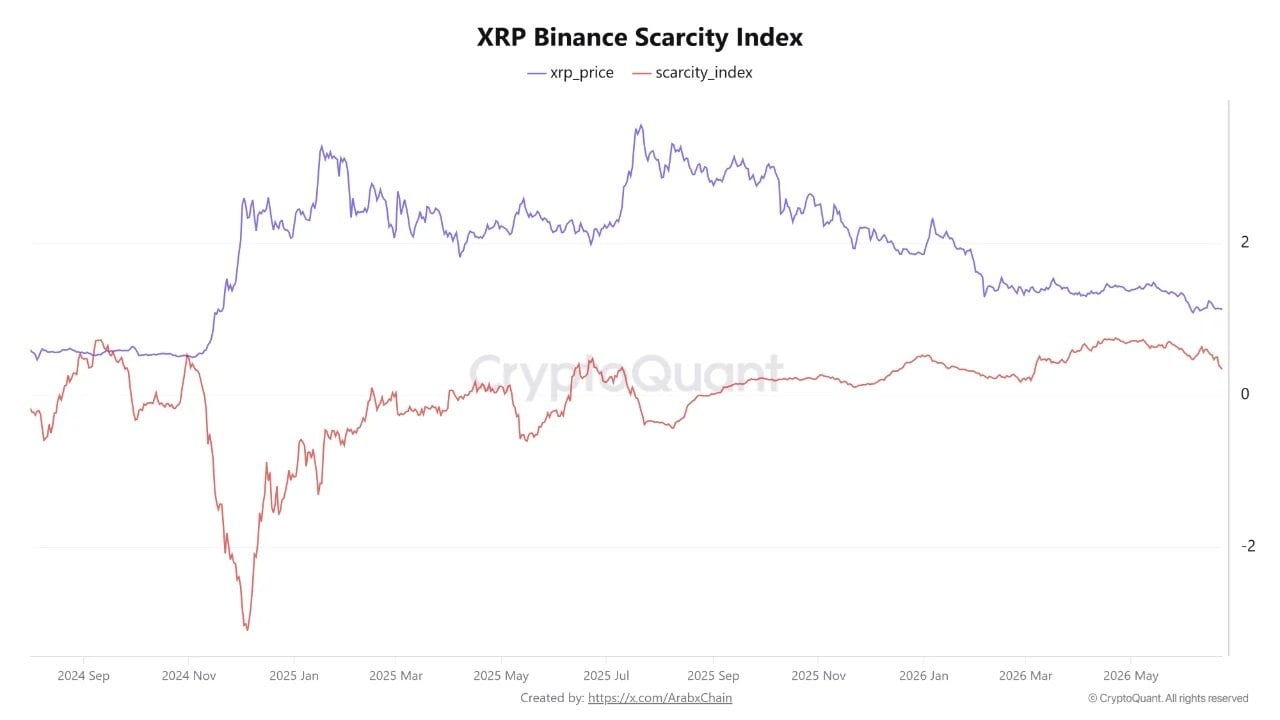
Binance Supply Rises as Scarcity Index Hits Lowest Point in Months
A Cryptoquant analysis published June 22 shows the XRP Binance Scarcity Index dropped to around 0.34, its lowest level in more than three months. The index measures available XRP supply on Binance relative to trading demand.
 Source: CryptoQuant
During April and May, the index was close to 0.80, signaling tighter supply. The drop to 0.34 means more XRP is now available on the exchange, which can limit upward price moves unless demand picks up.
CoinGlass data shows a large liquidation cluster between $1.13 and $1.15. If buyers step in at current support, that zone could attract price action and force short liquidations. In the past 24 hours, $13.53 million in XRP derivatives were liquidated, with long positions making up $13.01 million, or 96% of the total. Binance led with $7.59 million in liquidations, followed by Bybit at $2.57 million.
A break below $1.08 would put $1.05 and then $1.00 in focus as the next support levels.
The post XRP Price: Binance Supply Hits 3-Month High as Selling Pressure Builds appeared first on CoinCentral.


You May Also Like
Apple Price Shock: Macs And iPads Jump $200 Or More As Memory Crisis Worsens
Digital Currency X Technology Enters Into Securities Purchase Agreement for a Private Placement of US$700 Million of Units, Payable in U.S. Dollars or Digital Assets, to Advance Its Digital Asset Treasury Strategy

Jeers rain down on Sean Duffy over Great American Fair remarks: 'You're garbage'


