

Solana (SOL) Price: SOL Hits 3-Year Low — Is the Worst Finally Over?
TLDR
- SOL bounced from the $60 region and is trading near $69–$64 range, but remains below key moving averages
- Derivatives data is bearish: long-to-short ratio fell to 0.94 and funding rates turned negative
- Eight consecutive red monthly candles mark the worst stretch in Solana’s history
- Analyst BATMAN flagged SOL is trapped in a symmetrical wedge with bearish MACD divergence below the 200 EMA near $74
- Spot Solana ETFs saw $137,290 in net inflows Tuesday, showing some institutional interest remains
Solana has bounced off the $60 level but the recovery is fragile. The price is trading around $69, still below key moving averages and facing a tough set of resistance levels ahead.
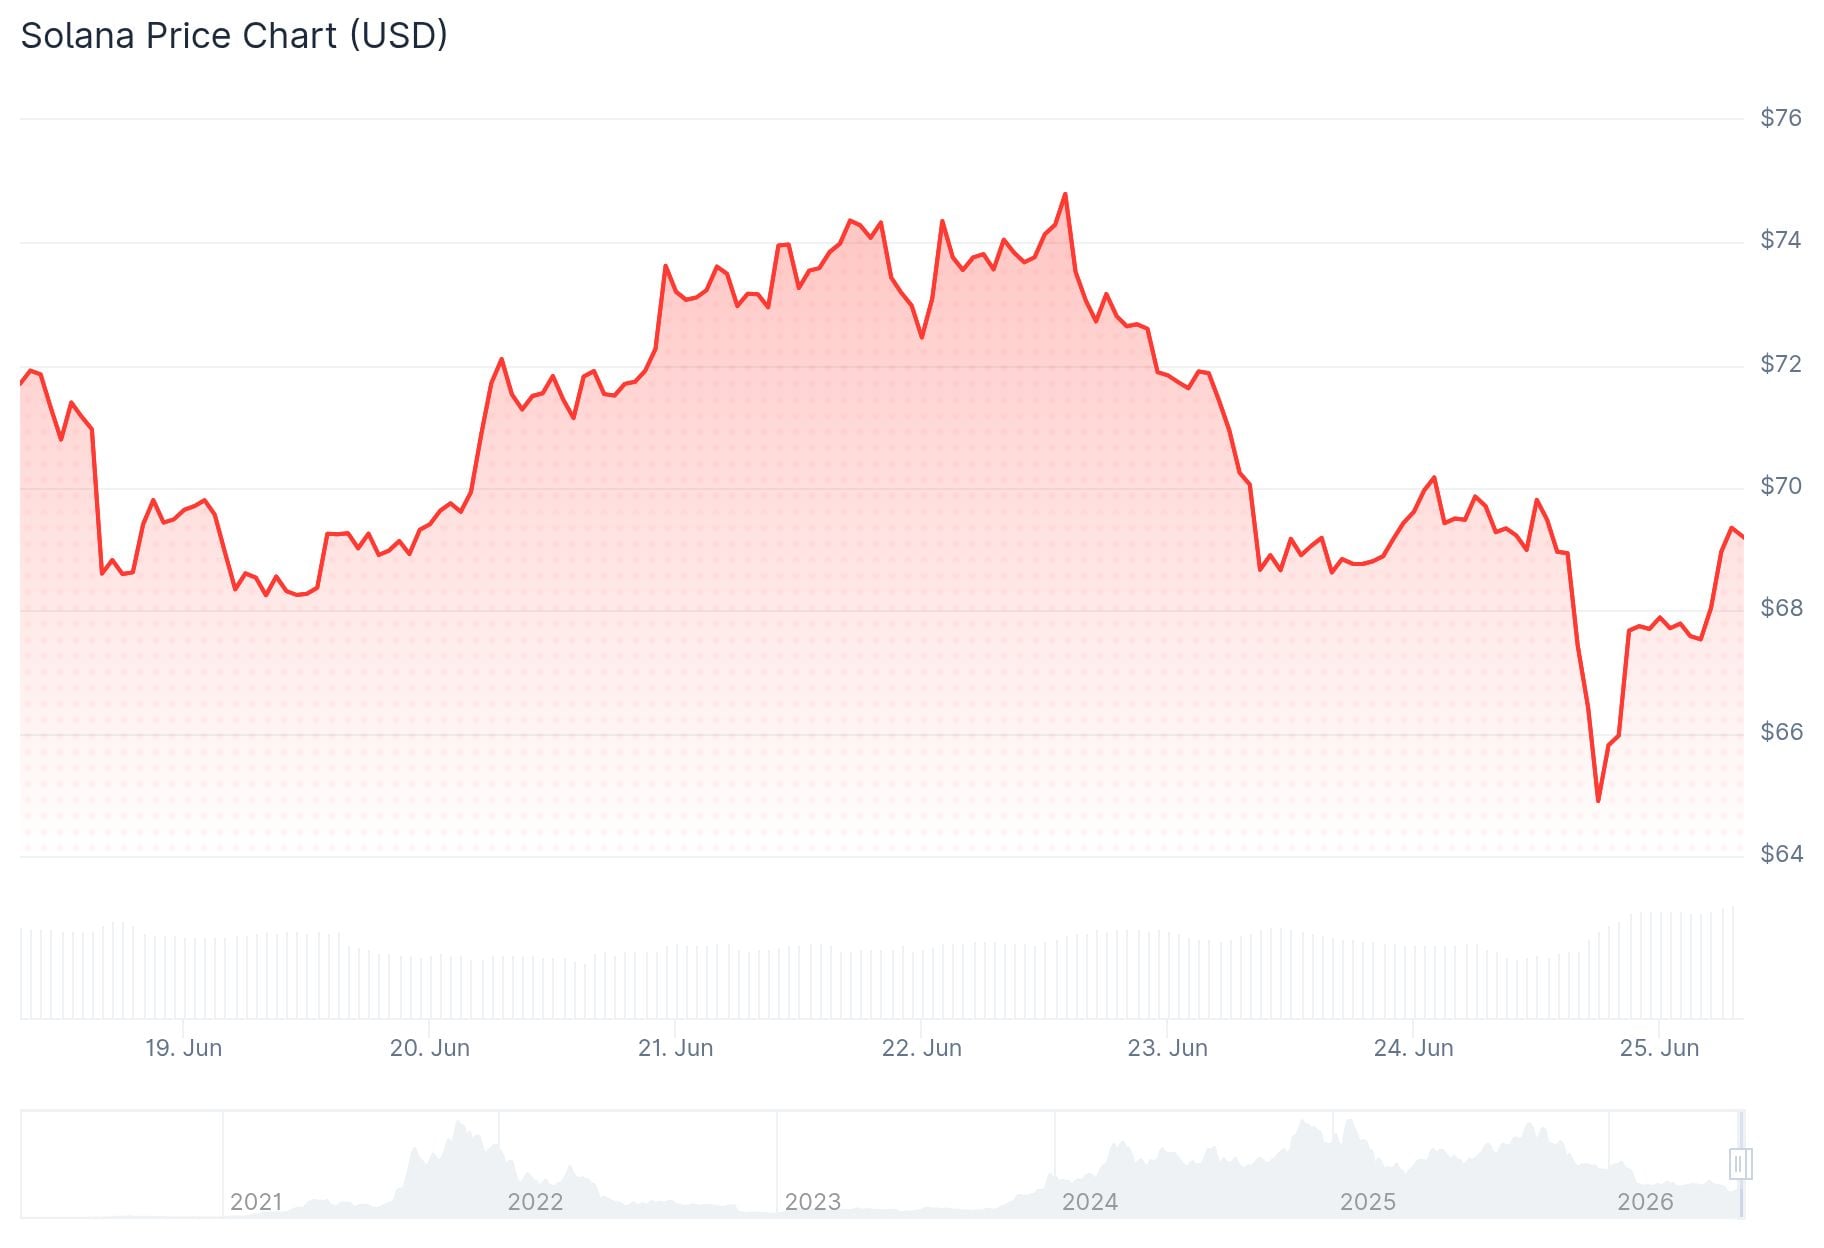 Solana (SOL) Price
The $60 zone has become an important psychological support area. Buyers stepped in there, pushing SOL back up over 5% in 24 hours at one point. But sellers are still applying pressure above.
Derivatives data is not encouraging. Solana’s long-to-short ratio dropped to 0.94 on Wednesday, per CoinGlass. A ratio below 1.0 means short positions outnumber longs, pointing to bearish sentiment among traders.
Funding rates also went negative earlier this week, sitting at -0.0080% on Wednesday. That means shorts are paying longs, which typically signals traders expect prices to keep falling.
Crypto analyst BATMAN flagged on June 24 that SOL is trapped inside a large symmetrical wedge on the chart. Volatility is compressing toward the apex, and the price is struggling below the 200 EMA near $74. The MACD is printing bearish divergence and losing momentum. BATMAN noted that Solana is “running out of room” and raised the question of whether SOL will break below $69.
Key Resistance Levels to Watch
SOL is currently below its 50-day, 100-day, and 200-day EMAs. These act as a stacked resistance zone that buyers need to clear.
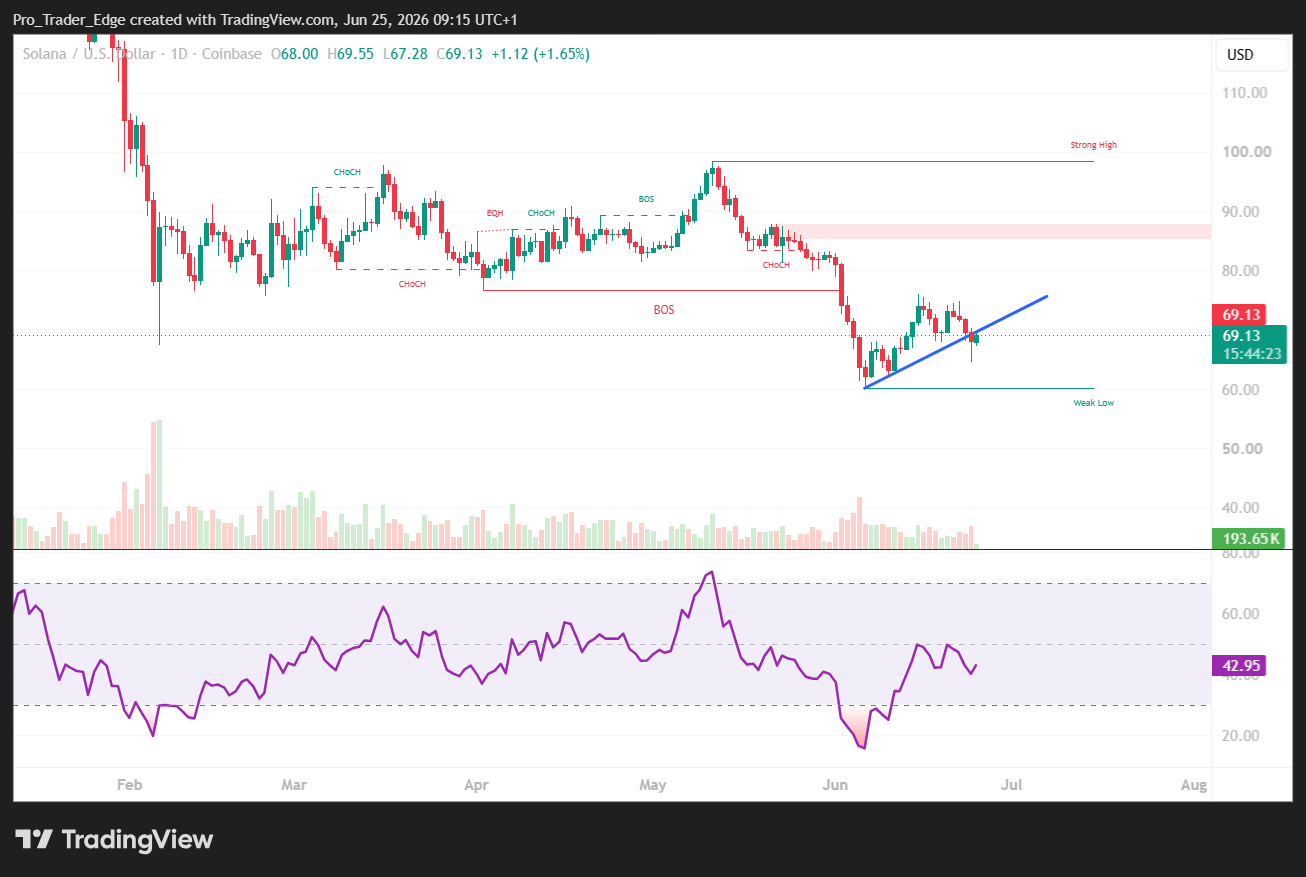 Source: TradingView
The first hurdle is around $74.75. Above that is the 50-day EMA near $76.18. A stronger move could test the 50% Fibonacci retracement at $79.27, then the 100-day EMA at $83.03.
The MACD on the 4-hour chart is flattening, and the RSI sits near 46, below the neutral 50 mark. Neither indicator supports an immediate strong rally from current levels.
On the monthly chart, things look extreme. Analyst Ash Crypto pointed out that SOL has printed eight straight red monthly candles, a first in its history. The monthly RSI is now more oversold than during the 2022 FTX collapse, when SOL fell to around $8.
Signs of Potential Support
Not everything points down. Spot Solana ETFs recorded $137,290 in net inflows on Tuesday, according to SoSoValue. It is a modest figure but it shows some institutional demand is still present.
Some analysts are watching the $50–$40 zone as a potential accumulation area. Rod’s chart suggests that if SOL builds a base there, a longer-term recovery toward $175 could develop. Trader Symba’s SOL/BTC analysis points to a long-term demand zone nearby, with a view toward new highs above $300 eventually.
A 1-hour chart trendline breakout was flagged by CryptoJack, showing early signs that immediate downside momentum may be easing. Key levels to hold are $62–$63, with upside targets at $68, $70, and then $76.
SOL’s long-to-short ratio sat at 0.94 and funding rates were at -0.0080% as of Wednesday, with the price hovering around $69.58.
The post Solana (SOL) Price: SOL Hits 3-Year Low — Is the Worst Finally Over? appeared first on CoinCentral.


You May Also Like

How Much Will One Bitcoin Be Worth in 2030?

Top U.S. economist says Gold reversal is imminent

MEV Extraction and What It Means for Price Discovery in DeFi


