Solana (SOL) drops 20% monthly amid 2,400% exchange inflow spike, but DEX volume climbs 39% and tokenized stocks reach $1.3B in trading activity. The post SolanaSolana (SOL) drops 20% monthly amid 2,400% exchange inflow spike, but DEX volume climbs 39% and tokenized stocks reach $1.3B in trading activity. The post Solana

Solana (SOL) Price Plunges 20% While Network Activity Hits Record Highs

2026/06/26 15:25
3 min read
For feedback or concerns regarding this content, please contact us at crypto.news@mexc.com

Key Highlights

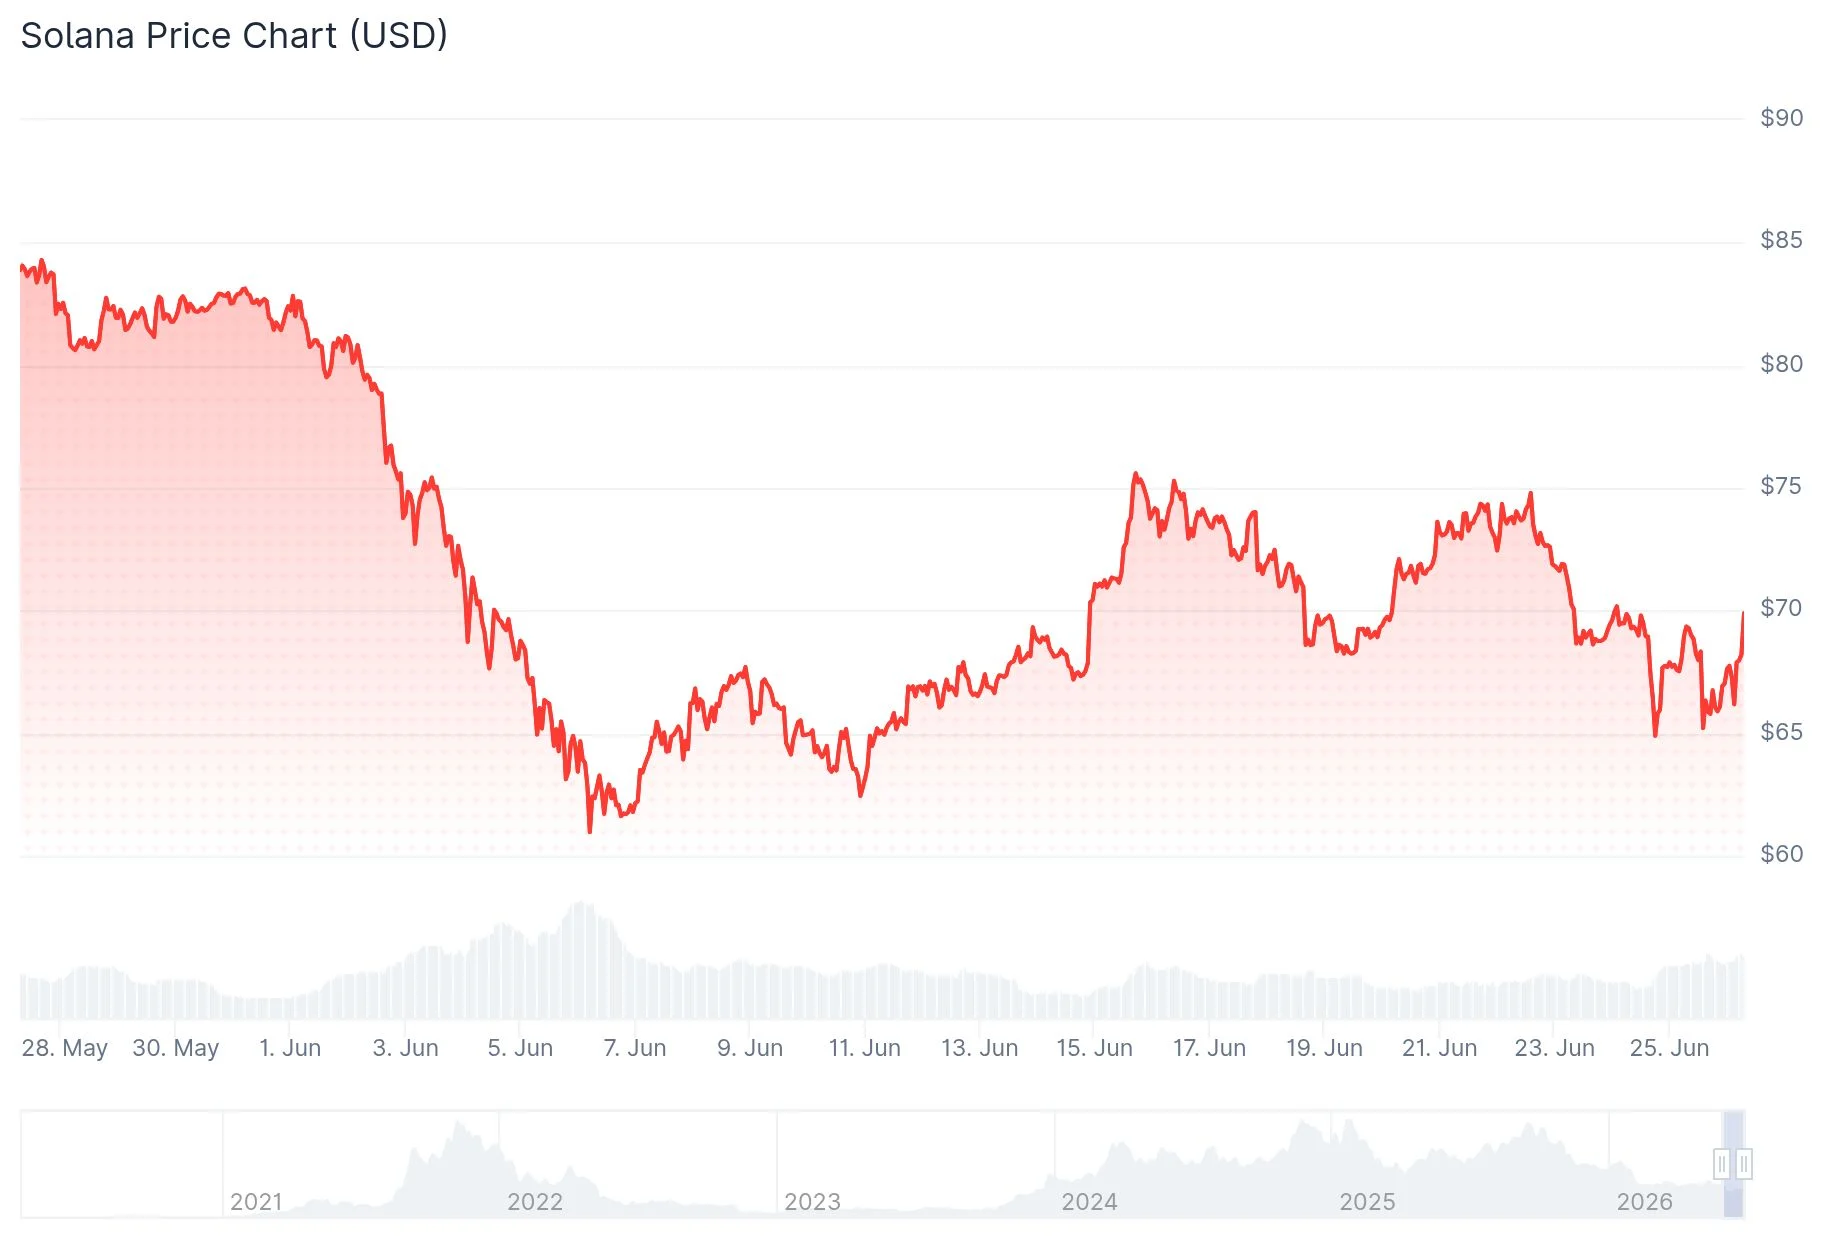
  • SOL has declined approximately 20% in the last 30 days and is down 44% year-to-date
  • Token deposits to exchanges increased roughly 2,400% from June 11 to June 25, indicating sustained distribution pressure
  • Decentralized exchange activity climbed 39%, reaching a seven-day mean of $1.73 billion daily
  • The network captured 95% of tokenized equity trading last week, processing $1.3 billion in volume
  • Meme coin platforms including PumpSwap and pump.fun dominate network fee revenue

The Solana network is experiencing a notable disconnect between price performance and on-chain metrics. While SOL has retreated approximately 20% in the past month and sits 44% lower for 2026, blockchain activity continues to accelerate, primarily fueled by decentralized trading and meme token speculation.

Solana (SOL) PriceSolana (SOL) Price

SOL currently trades near $68. Token movements to centralized exchanges—typically a precursor to selling activity—exploded from approximately 57,336 SOL on June 11 to roughly 1,410,650 SOL by June 25. This represents a dramatic 2,400% surge, effectively multiplying inflows by 25 times within a two-week period.

The gradual escalation of these inflows indicates persistent distribution rather than a reaction to any isolated market event.

Concurrently, trading activity on Solana-based decentralized exchanges increased by approximately 39%, pushing the seven-day average to $1.73 billion per day from about $1.24 billion a month earlier. Network transaction fees remained stable at roughly $7.2 million over 24 hours and $200 million throughout the past 30 days.

Source: DefiLlama

Meme Token Platforms and Emerging Exchanges Lead Activity

Network fee generation is heavily concentrated among a handful of applications. PumpSwap generated approximately $1.29 million in daily fees, while pump.fun contributed around $0.73 million. Jupiter’s perpetuals platform and the Axiom trading interface also ranked among top revenue generators.

Several decentralized exchanges dominate 24-hour volume metrics: BisonFi recorded nearly $359 million, Orca processed $329 million, and AlphaQ handled $241 million, outpacing both Meteora and Raydium at approximately $151 million each. The emergence of BisonFi and AlphaQ as volume leaders has prompted scrutiny regarding the authenticity of their trading activity.

Total value locked across Solana’s DeFi ecosystem decreased by about 13% to $4.74 billion, though market observers attribute most of this reduction to SOL’s depreciated value rather than capital flight.

Tokenized Equity Dominance and Alpenglow Network Enhancement

Solana processed approximately $1.3 billion in tokenized stock transactions last week, commanding roughly 95% of the entire blockchain-based tokenized equities sector. The June 12 SpaceX IPO catalyzed the creation of at least three tokenized SpaceX share instruments on Solana, representing about half of that week’s volume. Prior to this SpaceX-driven spike, Solana had already dominated on-chain tokenized equity volume for 54 straight weeks.

The aggregate on-chain tokenized stock market now stands at approximately $1.6 billion, up significantly from $317.1 million one year ago.

Cryptocurrency analyst Ardi (@ArdiNSC) stated on June 19 that he is monitoring for SOL to decline into the $45–60 range before considering accumulation for the upcoming market cycle. He observed that despite SOL peaking near $295 this cycle and already retracing roughly 77%, he identifies the $45–60 zone as where favorable risk-reward dynamics emerge. He characterized weekly support slightly above $50 as his “golden opportunity” should lower price levels fail to sustain, emphasizing he has no interest in purchasing at the current $68 level.

Solana’s planned Alpenglow upgrade, scheduled for late 2026, targets reducing transaction finality to subsecond speeds while preserving the network’s characteristic low costs and high throughput as institutional adoption expands.

As of June 25, exchange token deposits remain at elevated levels while SOL’s valuation continues tracking the wider cryptocurrency market correction.

The post Solana (SOL) Price Plunges 20% While Network Activity Hits Record Highs appeared first on Blockonomi.

Market Opportunity
Solana Logo
Solana Price(SOL)
$71.82
$71.82$71.82
-1.41%
USD
Solana (SOL) Live Price Chart
Disclaimer: The articles reposted on this site are sourced from public platforms and are provided for informational purposes only. They do not necessarily reflect the views of MEXC. All rights remain with the original authors. If you believe any content infringes on third-party rights, please contact crypto.news@mexc.com for removal. MEXC makes no guarantees regarding the accuracy, completeness, or timeliness of the content and is not responsible for any actions taken based on the information provided. The content does not constitute financial, legal, or other professional advice, nor should it be considered a recommendation or endorsement by MEXC.

You May Also Like

Ethereum koers toont zeldzaam dubbel koopsignaal en richt zich op $4.550

Ethereum koers toont zeldzaam dubbel koopsignaal en richt zich op $4.550

Connect met Like-minded Crypto Enthusiasts! Connect op Discord! Check onze Discord   Ethereum laat op de uurgrafiek twee opeenvolgende TD Sequential koopsignalen zien. Deze indicator meet uitputting in een trend en geeft vaak een signaal dat de verkoopdruk kan afnemen. Dit dubbele signaal verschijnt rond het niveau van $4.516, waar de ETH prijs kortstondig steun vindt. Dit type formatie komt zelden voor en wordt daarom extra nauwlettend gevolgd. Wat gaat de Ethereum koers hiermee doen? Ethereum koers test steun rond $4.516 De scherpe daling van de Ethereum koers vanaf de prijszone rond $4.800 bracht de ETH prijs in korte tijd naar ongeveer $4.516. Op dit niveau trad duidelijke koopactiviteit op, waardoor de neerwaartse beweging tijdelijk werd gestopt. Het dubbele signaal dat door de TD Sequential indicator is gegenereerd, viel precies samen met dit prijspunt. De TD Sequential is opgebouwd uit negen candles die een trend meetellen. Wanneer de negende candle verschijnt, kan dit duiden op een trendomslag. In dit geval verschenen zelfs twee signalen kort na elkaar, wat aangeeft dat de verkoopdruk mogelijk uitgeput is. Het feit dat dit gebeurde in een zone waar ETH kopers actief bleven, maakt het patroon extra opvallend. TD Sequential just flashed two buy signals for Ethereum $ETH! pic.twitter.com/JPO8EhiEPi — Ali (@ali_charts) September 16, 2025 Welke crypto nu kopen?Lees onze uitgebreide gids en leer welke crypto nu kopen verstandig kan zijn! Welke crypto nu kopen? Fed-voorzitter Jerome Powell heeft aangekondigd dat de rentes binnenkort zomaar eens omlaag zouden kunnen gaan, en tegelijkertijd blijft BlackRock volop crypto kopen, en dus lijkt de markt klaar om te gaan stijgen. Eén vraag komt telkens terug: welke crypto moet je nu kopen? In dit artikel bespreken we de munten die… Continue reading Ethereum koers toont zeldzaam dubbel koopsignaal en richt zich op $4.550 document.addEventListener('DOMContentLoaded', function() { var screenWidth = window.innerWidth; var excerpts = document.querySelectorAll('.lees-ook-description'); excerpts.forEach(function(description) { var excerpt = description.getAttribute('data-description'); var wordLimit = screenWidth wordLimit) { var trimmedDescription = excerpt.split(' ').slice(0, wordLimit).join(' ') + '...'; description.textContent = trimmedDescription; } }); }); Technische indicatoren schetsen herstelkans voor ETH Naast de dubbele koopsignalen verstrekken ook andere indicatoren belangrijke aanwijzingen. Tijdens de daling van de ETH koers waren grote rode candles zichtbaar, maar na de test van $4.516 stabiliseerde de Ethereum koers. Dit wijst op een mogelijke verschuiving in het evenwicht tussen de bears en bulls. Als deze opwaartse beweging doorzet, liggen de eerste weerstanden rond $4.550. Daarboven wacht een sterkere zone rond $4.650. Deze niveaus zijn in eerdere Ethereum sessies al meerdere keren getest. Een doorbraak zou ruimte openen richting de all-time high van ETH rond $4.953. Wanneer de prijs toch opnieuw onder $4.516 zakt, liggen er zones rond $4.500 en $4.450 waar grotere kooporders worden verwacht. Deze niveaus kunnen als een vangnet fungeren, mocht de druk opnieuw toenemen. Marktdynamiek bevestigt technische indicatoren De huidige situatie volgt op een bredere correctie in de cryptomarkt. Verschillende vooraanstaande crypto tokens zagen scherpe koersdalingen, waarna traders op zoek gingen naar signalen voor een mogelijke ommekeer. Dat juist Ethereum nu een dubbel TD Sequential signaal toont, versterkt de interesse in dit scenario. Fundamenteel blijft Ethereum sterk. Het aantal ETH tokens dat via staking is vastgezet, blijft groeien. Dat verkleint de vrije circulatie en vermindert verkoopdruk. Tegelijk blijft het netwerk intensief gebruikt voor DeFi, NFT’s en stablecoins. Deze activiteiten zorgen voor een stabiele vraag naar ETH, ook wanneer de prijs tijdelijk onder druk staat. Fundamentele drijfveren achter de Ethereum koers De Ethereum koers wordt echter niet alleen bepaald door candles en patronen, maar ook door bredere factoren. Een stijgend percentage van de totale ETH supply staat vast in staking contracten. Hierdoor neemt de liquiditeit op exchanges af. Dit kan prijsschommelingen versterken wanneer er plotseling meer koopdruk ontstaat. Daarnaast is Ethereum nog steeds het grootste smart contract platform. Nieuwe standaarden zoals ERC-8004 en ontwikkelingen rond layer-2 oplossingen houden de activiteit hoog. Deze technologische vooruitgang kan de waardepropositie ondersteunen en zo indirect bijdragen aan een ETH prijsherstel. Het belang van de korte termijn dynamiek De komende handelsdagen zullen duidelijk maken of de bulls genoeg kracht hebben om door de weerstandszone rond $4.550 te breken. Voor de bears ligt de focus juist op het verdedigen van de prijsregio rond $4.516. De whales, die met grote handelsorders opereren, kunnen hierin een beslissende rol spelen. Het dubbele TD Sequential signaal blijft hoe dan ook een zeldzame gebeurtenis. Voor cryptoanalisten vormt het een objectief aanknopingspunt om de kracht van de huidige Ethereum trend te toetsen. Vooruitblik op de ETH koers Ethereum liet twee opeenvolgende TD Sequential signalen zien op de uurgrafiek, iets wat zelden voorkomt. Deze formatie viel samen met steun rond $4.516, waar de bulls actief werden. Als de Ethereum koers boven dit niveau blijft, kan er ruimte ontstaan richting $4.550 en mogelijk $4.650. Zakt de prijs toch opnieuw onder $4.516, dan komen $4.500 en $4.450 in beeld als nieuwe steunzones. De combinatie van zeldzame indicatoren en een sterke fundamentele basis maakt Ethereum interessant voor zowel technische als fundamentele analyses. Of de bulls het momentum echt kunnen overnemen, zal blijken zodra de Ethereum koers de eerstvolgende weerstanden opnieuw test. Koop je crypto via Best Wallet Best wallet is een topklasse crypto wallet waarmee je anoniem crypto kan kopen. Met meer dan 60 chains gesupport kan je al je main crypto coins aanschaffen via Best Wallet. Best wallet - betrouwbare en anonieme wallet Best wallet - betrouwbare en anonieme wallet Meer dan 60 chains beschikbaar voor alle crypto Vroege toegang tot nieuwe projecten Hoge staking belongingen Lage transactiekosten Best wallet review Koop nu via Best Wallet Let op: cryptocurrency is een zeer volatiele en ongereguleerde investering. Doe je eigen onderzoek. Het bericht Ethereum koers toont zeldzaam dubbel koopsignaal en richt zich op $4.550 is geschreven door Dirk van Haaster en verscheen als eerst op Bitcoinmagazine.nl.
Share
Coinstats2025/09/17 23:31
Fed Day Dry Powder: Cryptoquant Analyst Tracks $7.6B Stablecoin Pile on Exchanges

Fed Day Dry Powder: Cryptoquant Analyst Tracks $7.6B Stablecoin Pile on Exchanges

The post Fed Day Dry Powder: Cryptoquant Analyst Tracks $7.6B Stablecoin Pile on Exchanges appeared on BitcoinEthereumNews.com. With the Federal Reserve meeting today, onchain flows are telegraphing that crypto traders are topping off exchanges and leaning long ahead of a widely expected 25-basis-point cut. Pre-Fed Positioning Stablecoins are doing the heavy lifting. Cryptoquant data shows $7.6 billion in fresh USDT and USDC (ERC-20) deposits heading to trading venues ahead of the decision. […] Source: https://news.bitcoin.com/fed-day-dry-powder-cryptoquant-analyst-tracks-7-6b-stablecoin-pile-on-exchanges/
Share
BitcoinEthereumNews2025/09/18 01:36
Michael Saylor’s Bitcoin Treasury Strategy Has Finally Hit Its Breaking Point

Michael Saylor’s Bitcoin Treasury Strategy Has Finally Hit Its Breaking Point

Bitcoin (CRYPTO:BTC) transformed from a niche digital asset into a mainstream investment over the past decade, and few people did more to accelerate that shift
Share
247 Wall St.2026/06/28 20:17

Newbies:Deposit $100, Get $1,000

Newbies:Deposit $100, Get $1,000Newbies:Deposit $100, Get $1,000

Plus Up to a $50 Referral Bonus