Over the past six weeks, investors have pulled roughly $5.94 billion from US spot Bitcoin ETFs, marking the longest unbroken run of weekly outflows since theseOver the past six weeks, investors have pulled roughly $5.94 billion from US spot Bitcoin ETFs, marking the longest unbroken run of weekly outflows since these

Did $6B in ETF outflows just mark Bitcoin’s first Wall Street capitulation?

2026/06/27 23:55
7 min read
For feedback or concerns regarding this content, please contact us at crypto.news@mexc.com

Over the past six weeks, investors have pulled roughly $5.94 billion from US spot Bitcoin ETFs, marking the longest unbroken run of weekly outflows since these funds first opened for business in 2024. Galaxy Research puts the worst 30-day stretch at $6.35 billion through June 20.

Bitcoin has been sliding right alongside those redemptions, and after a hot inflation print on Thursday, it dropped to a 21-month low near $58,000 before steadying around $59,000, which leaves it roughly 53% below the $126,080 record it set last October.

Despite the enormous outflows, the thing to pay attention to isn't the selling itself, but who's actually doing the selling. While the ETF crowd has been heading for the exits, the people who've held Bitcoin for years have barely budged: long-term holders, meaning anyone who's held for 155 days or more, own 16.64 million BTC, which amounts to close to 83% of everything in circulation.

bitcoin lth supply
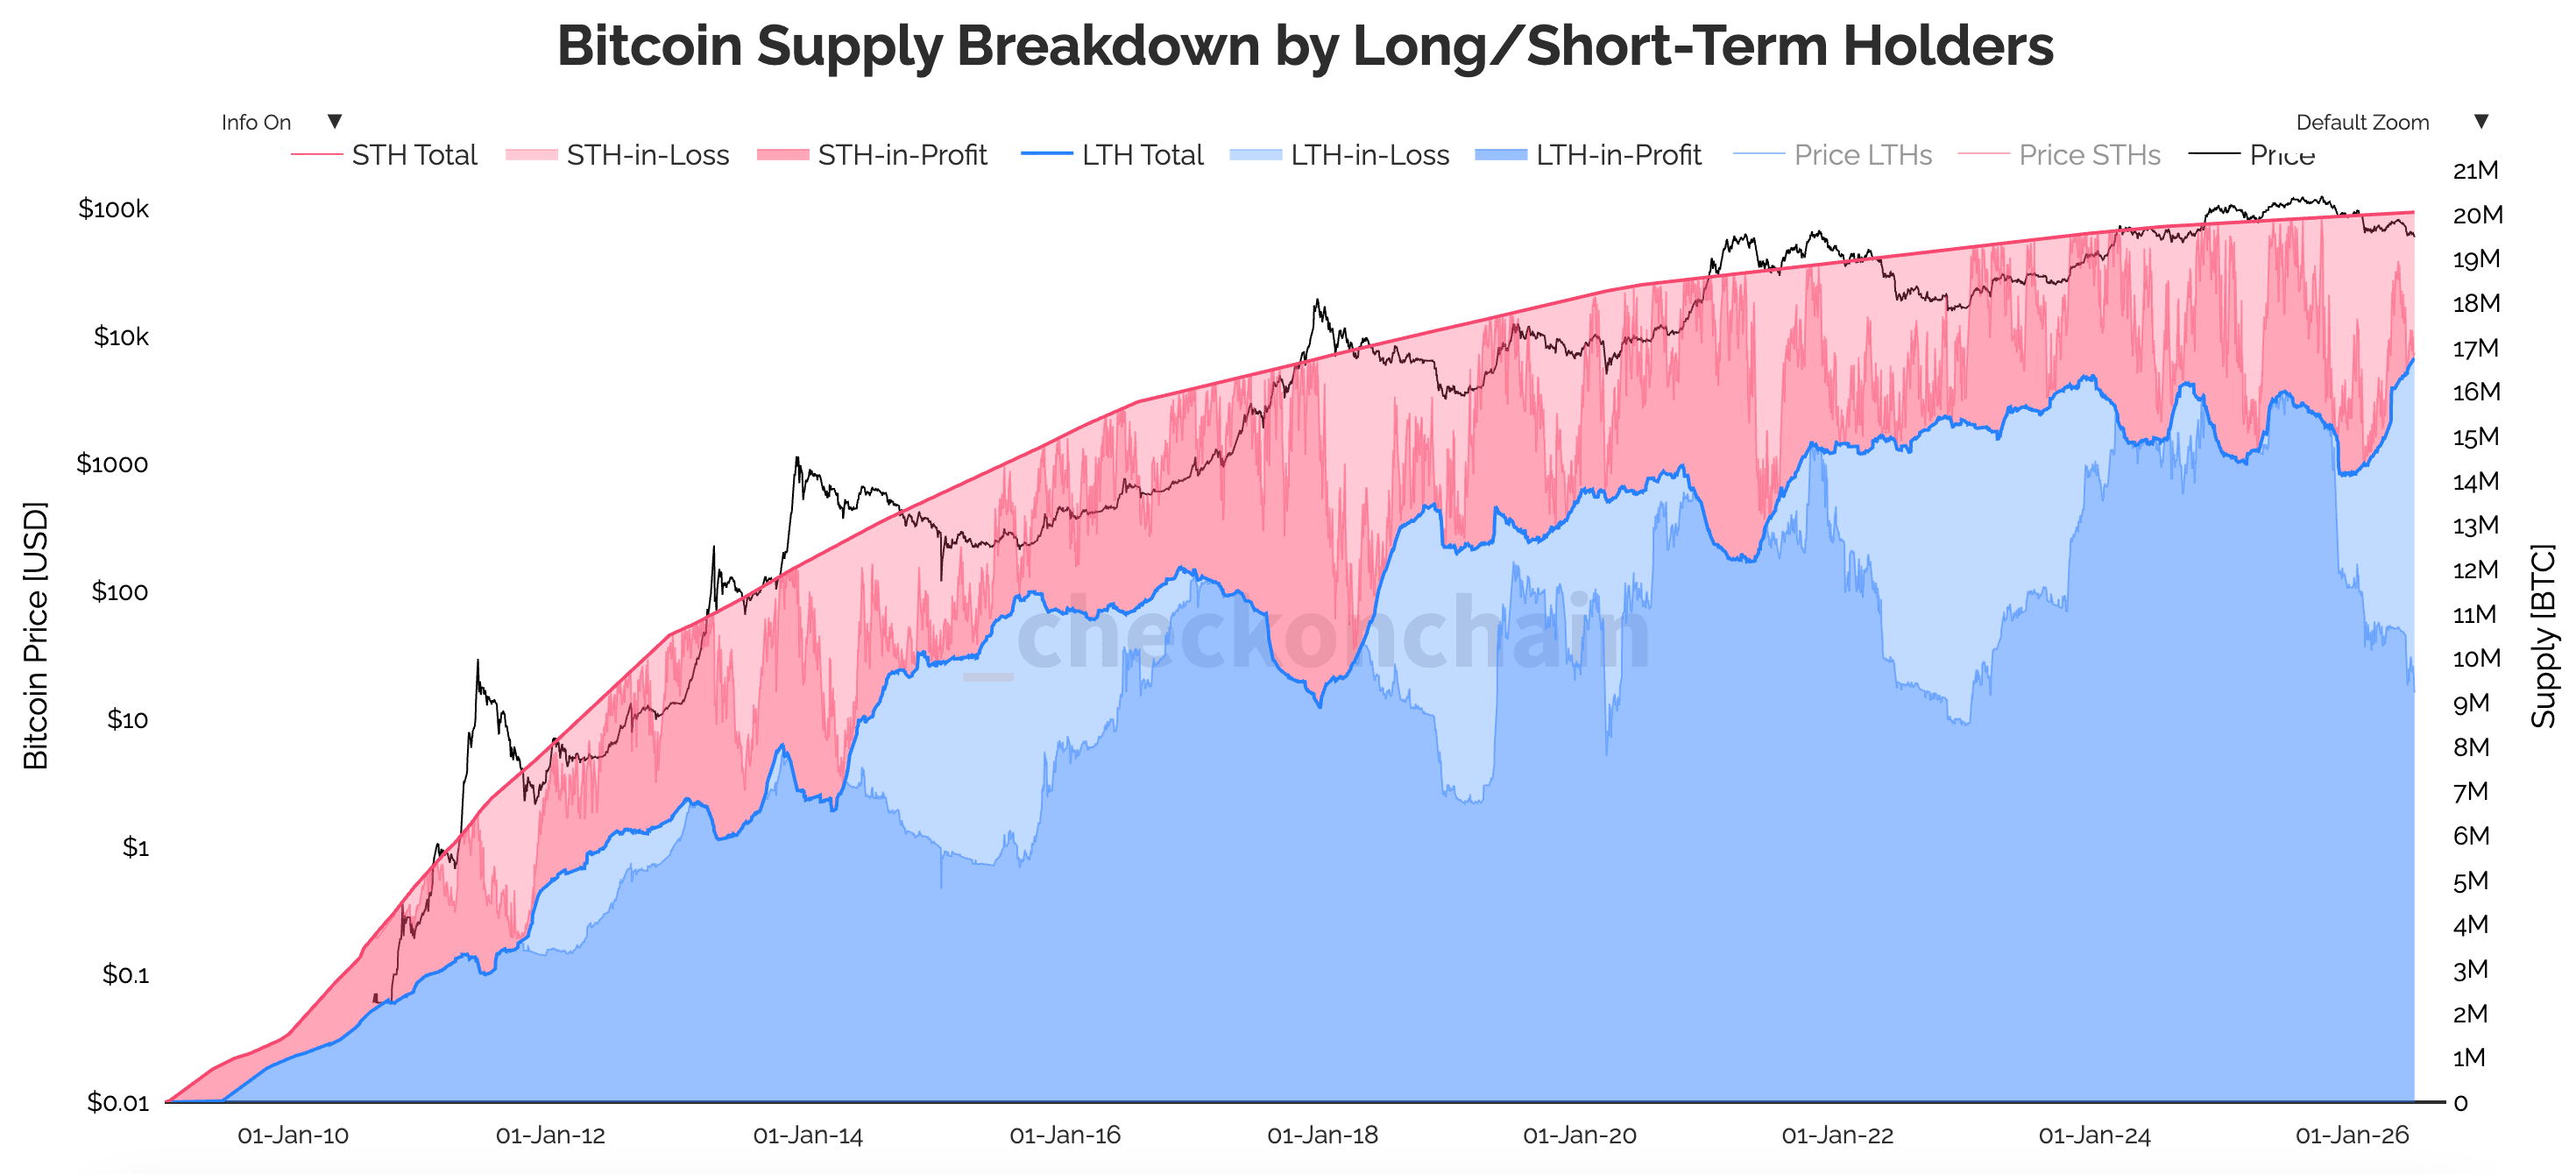
Graph showing the breakdown of Bitcoin's supply by long-term and short-term holders from 2009 to 2026 (Source: Checkonchain)

So the supply is steadily piling up with the folks who've lived through drawdowns like this before, while the selling is coming almost entirely from allocators who showed up through a brokerage account. This is the first real capitulation for ETF holders, because it's the first time the wrapper that finally carried Wall Street into Bitcoin has shown it's losing its nerve.

The $6 billion ETF exit and who's actually leaving

If you watch how the money left, the pace tells you almost as much as the total does. The first week of June was particularly brutal, with $1.72 billion walking out the door, but by the week ending June 18, that had shrunk to just $226.8 million, a slowdown of nearly 87% in a few weeks.

Jeff Ko, the chief analyst at CoinEx, said the deceleration was a sign the selling wave is wearing itself out rather than building, with the worst of the pressure probably already behind the market.

The damage to the products themselves is still significant. Total assets under management fell from above $104 billion to around $80 billion over this period, and cumulative net inflows since launch slid from a peak near $63 billion last October to about $53.4 billion now.

bitcoin etfs aum
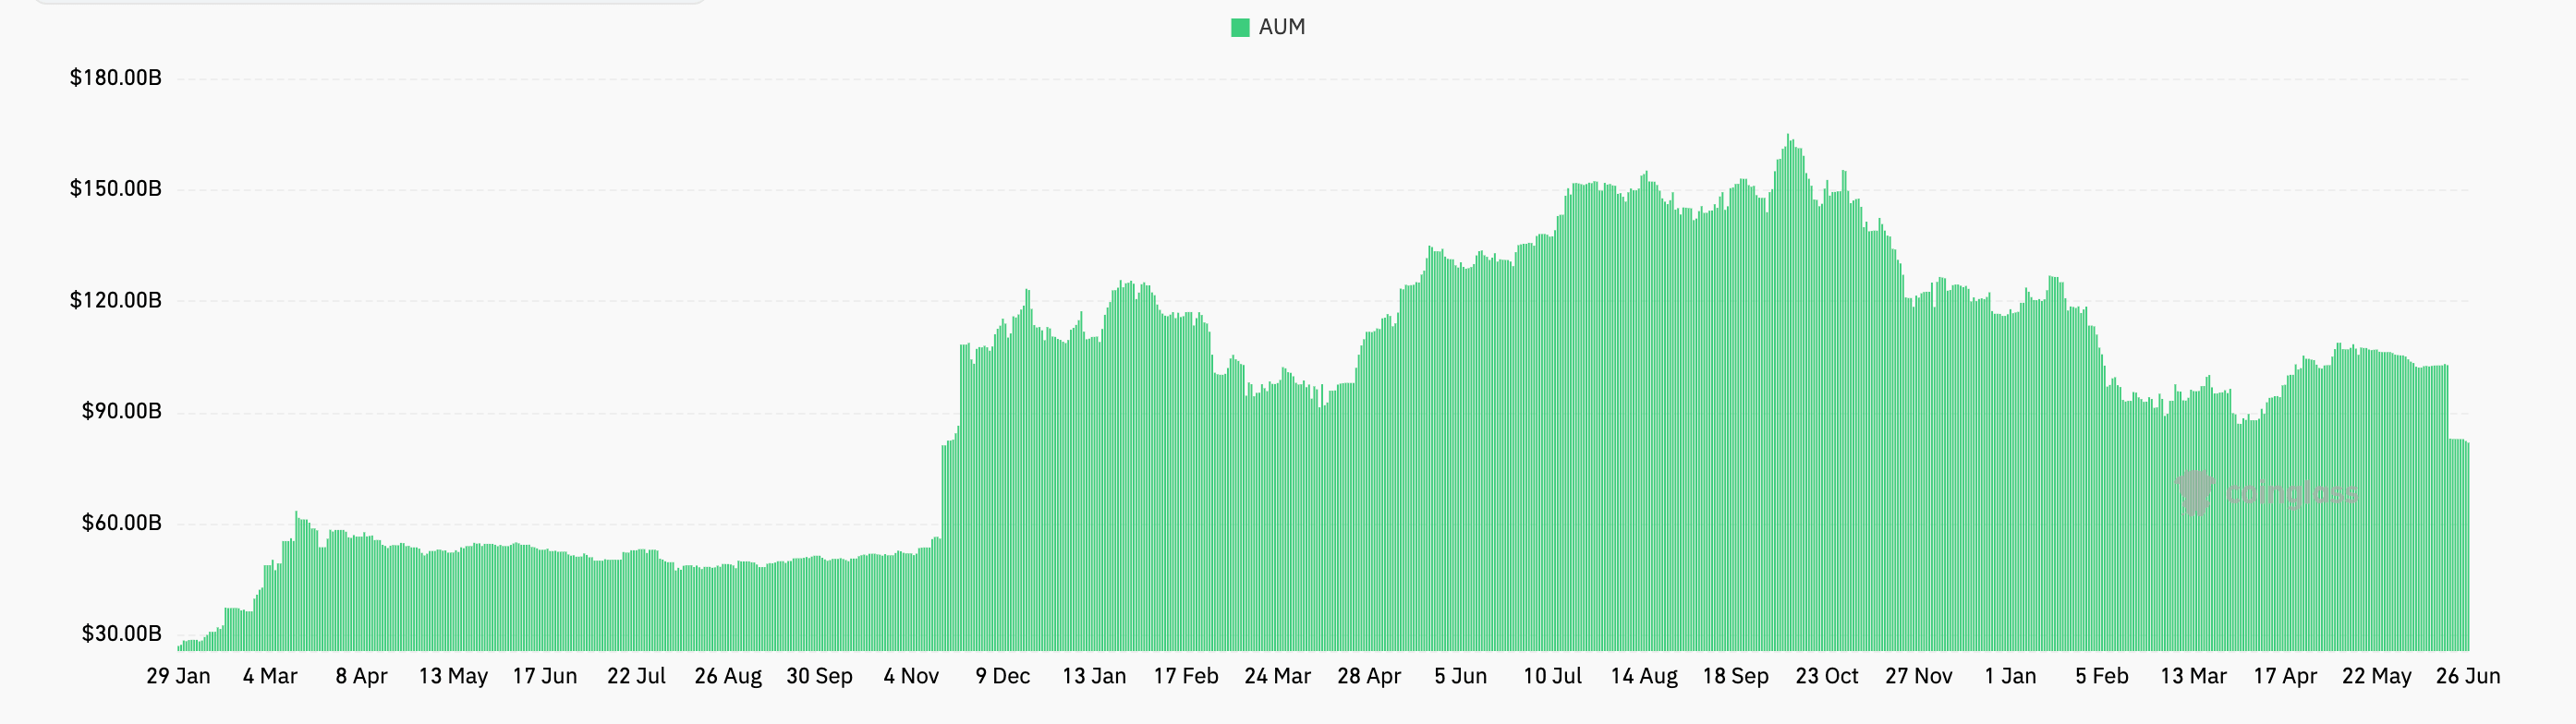
Chart showing the assets under management (AUM) for spot Bitcoin ETFs from Jan. 29 to June 26, 2026 (Source: CoinGlass)

To put it another way, a full year's worth of accumulated capital thinned out in a matter of weeks.

When you ask what's actually pulling the money out, the answer looks a lot more like ordinary portfolio housekeeping than some grand stand on Bitcoin itself.

Marion Laboure at Deutsche Bank now describes Bitcoin as an institutional risk asset, with ETF allocators and corporate treasuries now the marginal buyers. So when those desks decide to trim risk across the board, Bitcoin gets cut right along with everything else, and lately it's been getting cut hard.

A big part of the competition here is AI, as US technology giants are planning more than $700 billion in AI infrastructure spending for 2026. The SpaceX IPO and the pull of private names like OpenAI and Anthropic have also become a magnet for most of the speculative dollars that used to flow toward crypto.

If you look at where these sellers actually bought in, this looks exactly like capitulation. VanEck's on-chain work shows realized losses jumping 78% month over month to $714 million, with the realized-profit-to-loss ratio collapsing all the way to 0.27 from 1.11, and the bulk of those sellers had bought somewhere between $55,000 and $68,000, which means they're locking in losses right near the floor of their own range.

CryptoSlate flagged the early version of this same setup back in May, when fresh redemptions exposed BTC to Wall Street's most crowded trade. Even Strategy got in on the trimming, selling 32 BTC to cover dividend costs in its first net sale since 2022, though, to be fair, the company is still a heavy net accumulator.

Put it all together, and what you've got is coins moving out of the newest, most rattled hands and into the steadiest ones, which is more or less how the ownership base tends to reset near the end of a drawdown.

Why the price keeps sliding even as the strongest hands hold

You'd assume that a market where long-term holders own a record share of the supply would have less Bitcoin available to sell, and that's true. However, it still hasn't managed to put a floor under the price, and the reason is that supply and demand are two separate forces. Right now, demand is the one calling the shots.

Bitcoin trades only on what buyers are willing to pay, and right now, those buyers have gone quiet. Spot volumes have thinned out, on-chain activity has cooled off, and ETF trading volumes have fallen back to levels we last saw during earlier consolidation phases, so while a shrinking float can certainly hold a price steady, it can't lift it on its own without fresh demand to meet it.

The creations that carried Bitcoin all the way through 2025 aren't flowing into the funds anymore, a concern CryptoSlate raised back in March when it asked who buys Bitcoin after five straight weeks of ETF outflows. That demand began to crack in May, when ETF flows absorbed their first real macro shock in seven weeks.

That said, the $6 billion that left is still a single-digit slice of the $53 billion these funds are sitting on. CryptoSlate has previously made the case that headline outflow figures tend to overstate how much spot Bitcoin is actually changing hands.

Long-term holder flows are ten times ETF flows, and those holders are still net accumulating right through the weakness, so, on that measure, the whole sell-off looks more cyclical than structural. BlackRock has made its own version of this argument, treating much of the redemption activity as product rotation within client portfolios rather than as anyone walking away from the asset.

Nonetheless, it still looks rough in the near term. May's inflation data landed hot on Thursday, with headline PCE climbing to 4.1% year over year, its highest reading since 2023, and Bitcoin's reaction was instant: it dropped toward $58,000, dragging more than $1.2 billion in leveraged long positions across the crypto market down with it.

Wednesday alone saw another $469 million leave the funds, their biggest single-day exit since early June, which keeps them on track for a seventh straight negative week. On top of all that, a $10.6 billion Deribit options expiry cleared on Friday, with around 80% of the open interest sitting out of the money and traders bunched around a $60,000 put and an $80,000 call, which put all of that positioning right on top of the level Bitcoin is trying to defend.

And the macro backdrop is offering very little cover, because Kevin Warsh's Fed has already dropped its easing language and nudged its year-end inflation forecast higher, with the market now pricing the odds of a December rate hike somewhere around 77%.

So the divide just keeps hardening. The allocators who came in for clean, regulated, convenient exposure are finding out the hard way that the convenience never actually stripped out the volatility, and they're walking right back out at a loss. The holders who've watched this same sequence play out a few times already are doing what they've always done at the lows: waiting it out.

Wall Street finally owns Bitcoin, and the first real lesson it gave them was a measurement of how much of it these new owners could carry through a proper drawdown. For a meaningful chunk of them, the honest answer turned out to be quite a bit less than they'd signed up for.

The post Did $6B in ETF outflows just mark Bitcoin’s first Wall Street capitulation? appeared first on CryptoSlate.

Market Opportunity
SIX Logo
SIX Price(SIX)
$0.0057
$0.0057$0.0057
-0.69%
USD
SIX (SIX) Live Price Chart
Disclaimer: The articles reposted on this site are sourced from public platforms and are provided for informational purposes only. They do not necessarily reflect the views of MEXC. All rights remain with the original authors. If you believe any content infringes on third-party rights, please contact crypto.news@mexc.com for removal. MEXC makes no guarantees regarding the accuracy, completeness, or timeliness of the content and is not responsible for any actions taken based on the information provided. The content does not constitute financial, legal, or other professional advice, nor should it be considered a recommendation or endorsement by MEXC.

You May Also Like

Ethereum koers toont zeldzaam dubbel koopsignaal en richt zich op $4.550

Ethereum koers toont zeldzaam dubbel koopsignaal en richt zich op $4.550

Connect met Like-minded Crypto Enthusiasts! Connect op Discord! Check onze Discord   Ethereum laat op de uurgrafiek twee opeenvolgende TD Sequential koopsignalen zien. Deze indicator meet uitputting in een trend en geeft vaak een signaal dat de verkoopdruk kan afnemen. Dit dubbele signaal verschijnt rond het niveau van $4.516, waar de ETH prijs kortstondig steun vindt. Dit type formatie komt zelden voor en wordt daarom extra nauwlettend gevolgd. Wat gaat de Ethereum koers hiermee doen? Ethereum koers test steun rond $4.516 De scherpe daling van de Ethereum koers vanaf de prijszone rond $4.800 bracht de ETH prijs in korte tijd naar ongeveer $4.516. Op dit niveau trad duidelijke koopactiviteit op, waardoor de neerwaartse beweging tijdelijk werd gestopt. Het dubbele signaal dat door de TD Sequential indicator is gegenereerd, viel precies samen met dit prijspunt. De TD Sequential is opgebouwd uit negen candles die een trend meetellen. Wanneer de negende candle verschijnt, kan dit duiden op een trendomslag. In dit geval verschenen zelfs twee signalen kort na elkaar, wat aangeeft dat de verkoopdruk mogelijk uitgeput is. Het feit dat dit gebeurde in een zone waar ETH kopers actief bleven, maakt het patroon extra opvallend. TD Sequential just flashed two buy signals for Ethereum $ETH! pic.twitter.com/JPO8EhiEPi — Ali (@ali_charts) September 16, 2025 Welke crypto nu kopen?Lees onze uitgebreide gids en leer welke crypto nu kopen verstandig kan zijn! Welke crypto nu kopen? Fed-voorzitter Jerome Powell heeft aangekondigd dat de rentes binnenkort zomaar eens omlaag zouden kunnen gaan, en tegelijkertijd blijft BlackRock volop crypto kopen, en dus lijkt de markt klaar om te gaan stijgen. Eén vraag komt telkens terug: welke crypto moet je nu kopen? In dit artikel bespreken we de munten die… Continue reading Ethereum koers toont zeldzaam dubbel koopsignaal en richt zich op $4.550 document.addEventListener('DOMContentLoaded', function() { var screenWidth = window.innerWidth; var excerpts = document.querySelectorAll('.lees-ook-description'); excerpts.forEach(function(description) { var excerpt = description.getAttribute('data-description'); var wordLimit = screenWidth wordLimit) { var trimmedDescription = excerpt.split(' ').slice(0, wordLimit).join(' ') + '...'; description.textContent = trimmedDescription; } }); }); Technische indicatoren schetsen herstelkans voor ETH Naast de dubbele koopsignalen verstrekken ook andere indicatoren belangrijke aanwijzingen. Tijdens de daling van de ETH koers waren grote rode candles zichtbaar, maar na de test van $4.516 stabiliseerde de Ethereum koers. Dit wijst op een mogelijke verschuiving in het evenwicht tussen de bears en bulls. Als deze opwaartse beweging doorzet, liggen de eerste weerstanden rond $4.550. Daarboven wacht een sterkere zone rond $4.650. Deze niveaus zijn in eerdere Ethereum sessies al meerdere keren getest. Een doorbraak zou ruimte openen richting de all-time high van ETH rond $4.953. Wanneer de prijs toch opnieuw onder $4.516 zakt, liggen er zones rond $4.500 en $4.450 waar grotere kooporders worden verwacht. Deze niveaus kunnen als een vangnet fungeren, mocht de druk opnieuw toenemen. Marktdynamiek bevestigt technische indicatoren De huidige situatie volgt op een bredere correctie in de cryptomarkt. Verschillende vooraanstaande crypto tokens zagen scherpe koersdalingen, waarna traders op zoek gingen naar signalen voor een mogelijke ommekeer. Dat juist Ethereum nu een dubbel TD Sequential signaal toont, versterkt de interesse in dit scenario. Fundamenteel blijft Ethereum sterk. Het aantal ETH tokens dat via staking is vastgezet, blijft groeien. Dat verkleint de vrije circulatie en vermindert verkoopdruk. Tegelijk blijft het netwerk intensief gebruikt voor DeFi, NFT’s en stablecoins. Deze activiteiten zorgen voor een stabiele vraag naar ETH, ook wanneer de prijs tijdelijk onder druk staat. Fundamentele drijfveren achter de Ethereum koers De Ethereum koers wordt echter niet alleen bepaald door candles en patronen, maar ook door bredere factoren. Een stijgend percentage van de totale ETH supply staat vast in staking contracten. Hierdoor neemt de liquiditeit op exchanges af. Dit kan prijsschommelingen versterken wanneer er plotseling meer koopdruk ontstaat. Daarnaast is Ethereum nog steeds het grootste smart contract platform. Nieuwe standaarden zoals ERC-8004 en ontwikkelingen rond layer-2 oplossingen houden de activiteit hoog. Deze technologische vooruitgang kan de waardepropositie ondersteunen en zo indirect bijdragen aan een ETH prijsherstel. Het belang van de korte termijn dynamiek De komende handelsdagen zullen duidelijk maken of de bulls genoeg kracht hebben om door de weerstandszone rond $4.550 te breken. Voor de bears ligt de focus juist op het verdedigen van de prijsregio rond $4.516. De whales, die met grote handelsorders opereren, kunnen hierin een beslissende rol spelen. Het dubbele TD Sequential signaal blijft hoe dan ook een zeldzame gebeurtenis. Voor cryptoanalisten vormt het een objectief aanknopingspunt om de kracht van de huidige Ethereum trend te toetsen. Vooruitblik op de ETH koers Ethereum liet twee opeenvolgende TD Sequential signalen zien op de uurgrafiek, iets wat zelden voorkomt. Deze formatie viel samen met steun rond $4.516, waar de bulls actief werden. Als de Ethereum koers boven dit niveau blijft, kan er ruimte ontstaan richting $4.550 en mogelijk $4.650. Zakt de prijs toch opnieuw onder $4.516, dan komen $4.500 en $4.450 in beeld als nieuwe steunzones. De combinatie van zeldzame indicatoren en een sterke fundamentele basis maakt Ethereum interessant voor zowel technische als fundamentele analyses. Of de bulls het momentum echt kunnen overnemen, zal blijken zodra de Ethereum koers de eerstvolgende weerstanden opnieuw test. Koop je crypto via Best Wallet Best wallet is een topklasse crypto wallet waarmee je anoniem crypto kan kopen. Met meer dan 60 chains gesupport kan je al je main crypto coins aanschaffen via Best Wallet. Best wallet - betrouwbare en anonieme wallet Best wallet - betrouwbare en anonieme wallet Meer dan 60 chains beschikbaar voor alle crypto Vroege toegang tot nieuwe projecten Hoge staking belongingen Lage transactiekosten Best wallet review Koop nu via Best Wallet Let op: cryptocurrency is een zeer volatiele en ongereguleerde investering. Doe je eigen onderzoek. Het bericht Ethereum koers toont zeldzaam dubbel koopsignaal en richt zich op $4.550 is geschreven door Dirk van Haaster en verscheen als eerst op Bitcoinmagazine.nl.
Share
Coinstats2025/09/17 23:31
Fed Day Dry Powder: Cryptoquant Analyst Tracks $7.6B Stablecoin Pile on Exchanges

Fed Day Dry Powder: Cryptoquant Analyst Tracks $7.6B Stablecoin Pile on Exchanges

The post Fed Day Dry Powder: Cryptoquant Analyst Tracks $7.6B Stablecoin Pile on Exchanges appeared on BitcoinEthereumNews.com. With the Federal Reserve meeting today, onchain flows are telegraphing that crypto traders are topping off exchanges and leaning long ahead of a widely expected 25-basis-point cut. Pre-Fed Positioning Stablecoins are doing the heavy lifting. Cryptoquant data shows $7.6 billion in fresh USDT and USDC (ERC-20) deposits heading to trading venues ahead of the decision. […] Source: https://news.bitcoin.com/fed-day-dry-powder-cryptoquant-analyst-tracks-7-6b-stablecoin-pile-on-exchanges/
Share
BitcoinEthereumNews2025/09/18 01:36
Michael Saylor’s Bitcoin Treasury Strategy Has Finally Hit Its Breaking Point

Michael Saylor’s Bitcoin Treasury Strategy Has Finally Hit Its Breaking Point

Bitcoin (CRYPTO:BTC) transformed from a niche digital asset into a mainstream investment over the past decade, and few people did more to accelerate that shift
Share
247 Wall St.2026/06/28 20:17

Newbies:Deposit $100, Get $1,000

Newbies:Deposit $100, Get $1,000Newbies:Deposit $100, Get $1,000

Plus Up to a $50 Referral Bonus