Solana Price Today: Bullish Signal Builds as Fear Hits 12
As of June 29, 2026, the Solana price today sits at approximately $72.75, technically recovered from recent lows but far from convincing. The intraday structure has quietly flipped bullish, yet the daily macro regime remains neutral-to-bearish — a tension that defines the current risk environment for SOL traders.
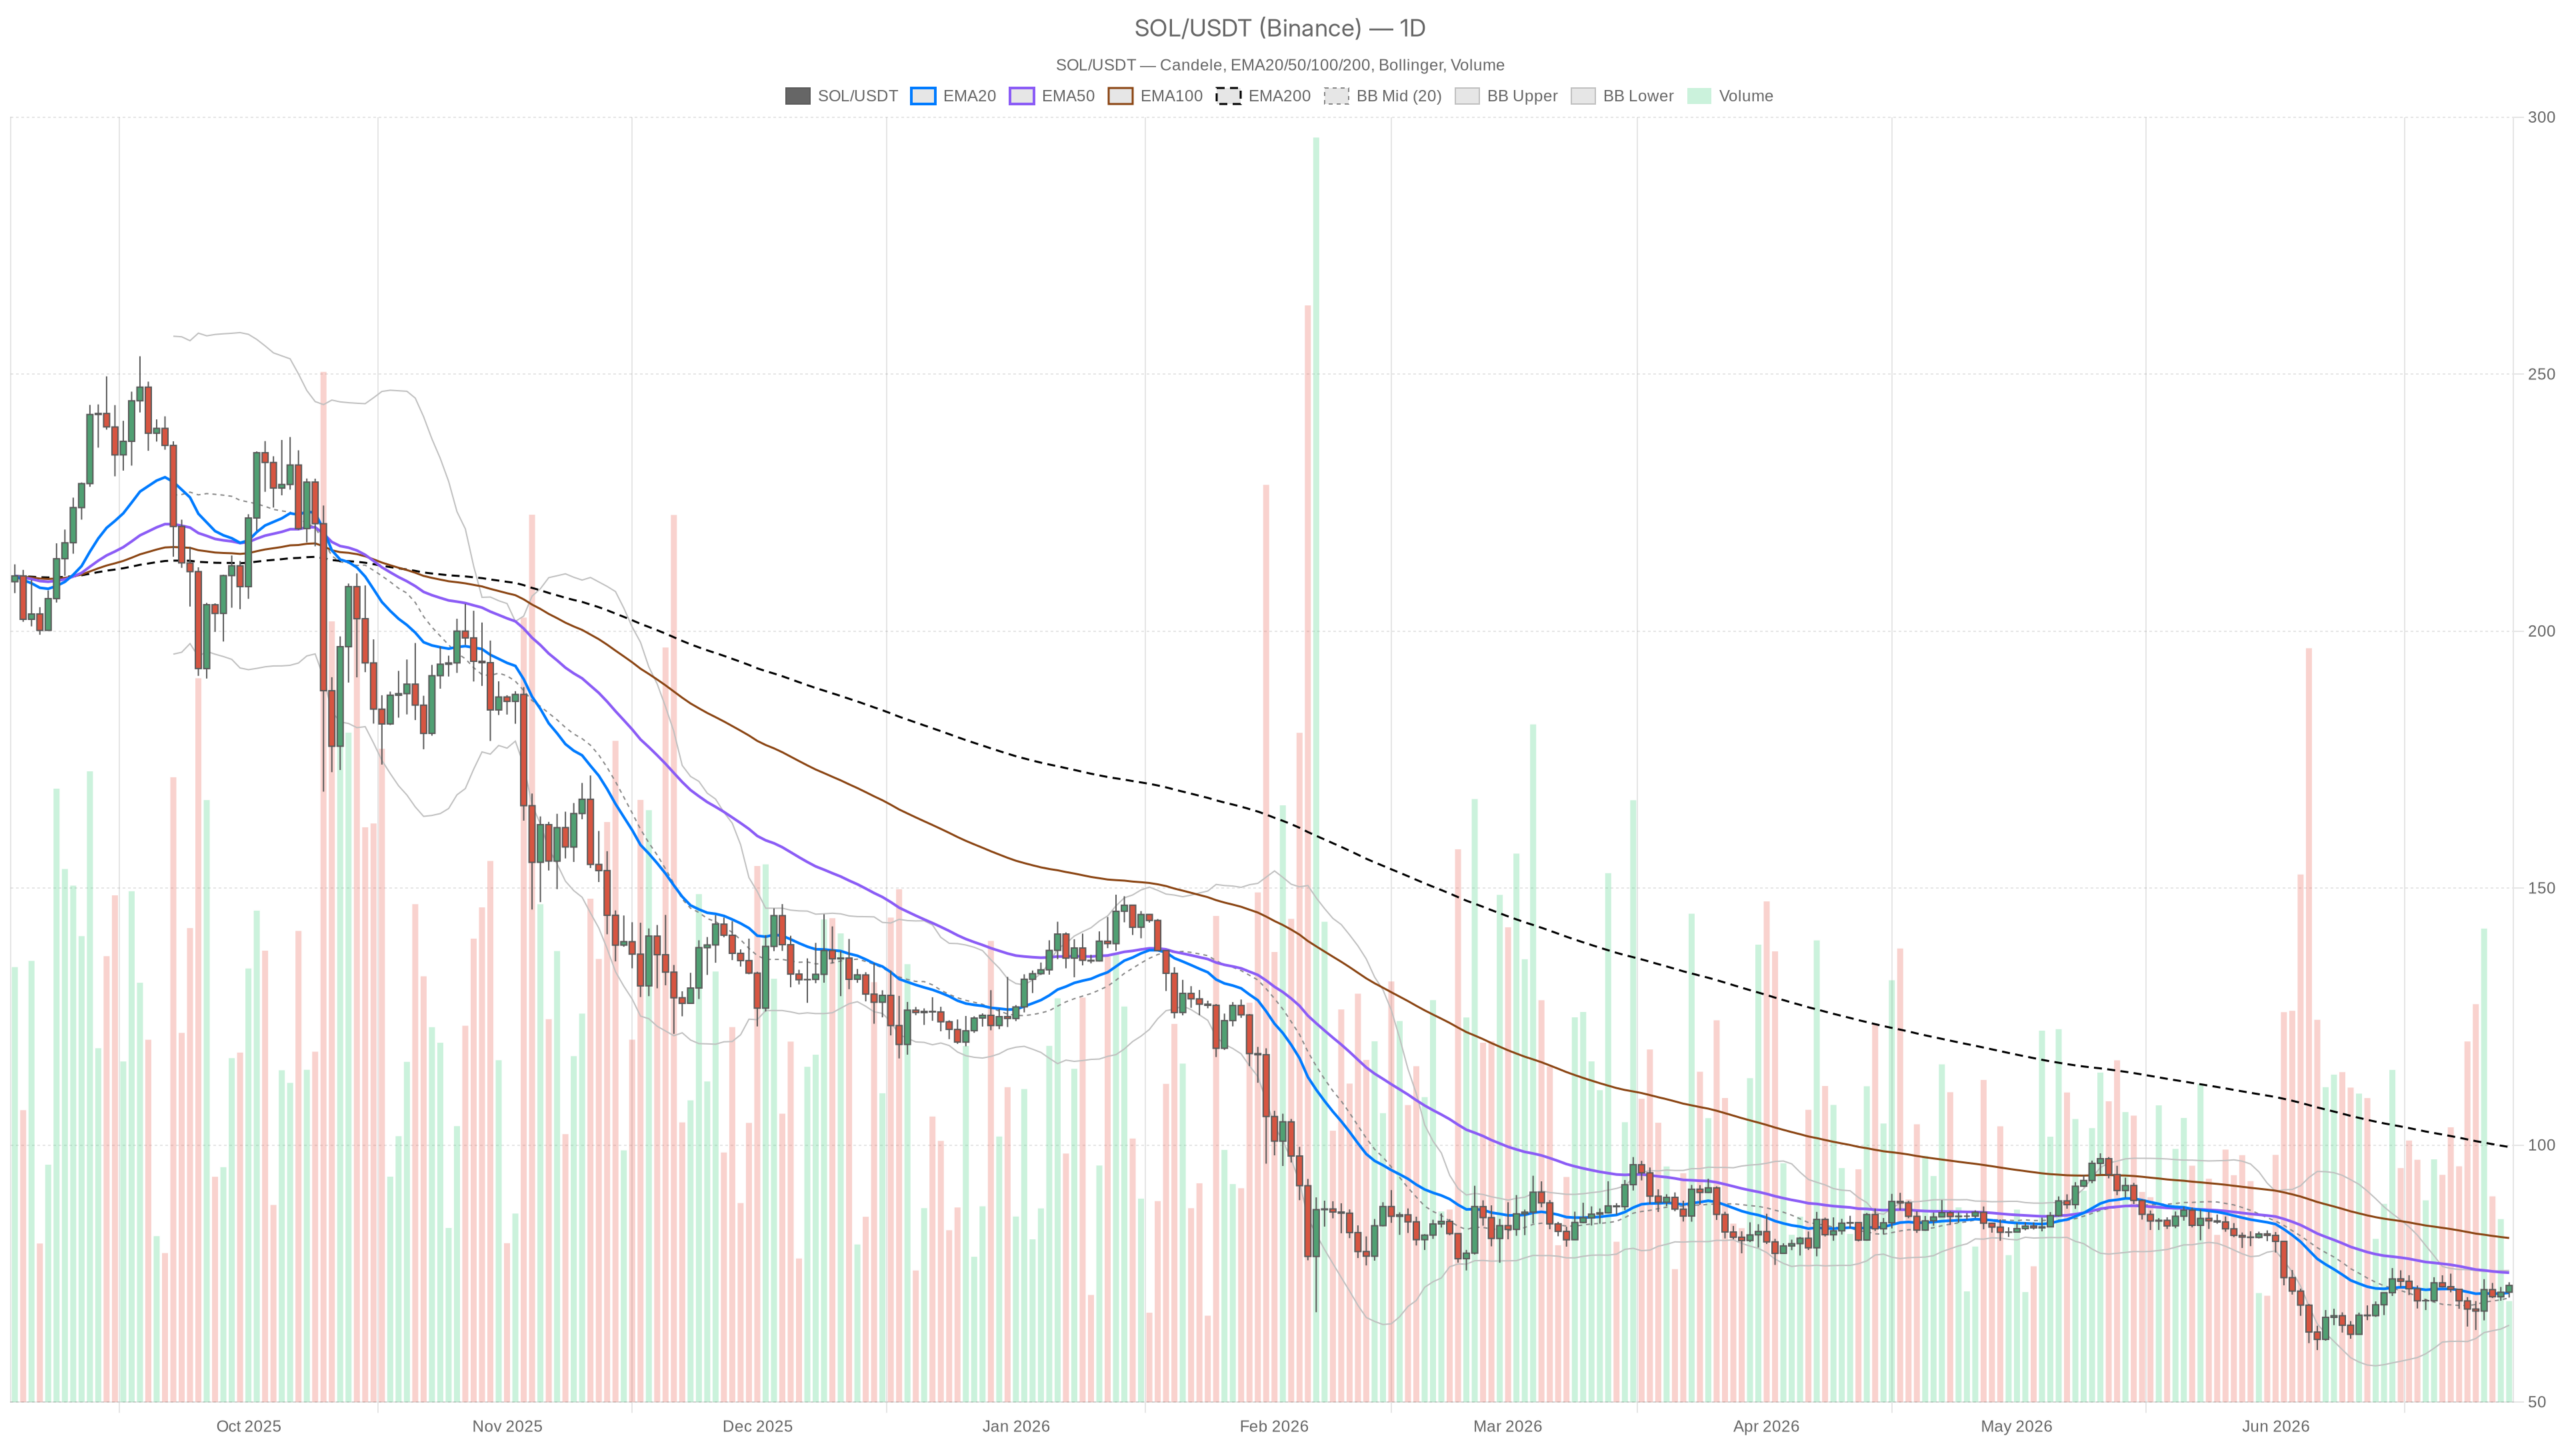 SOL/USDT — daily chart with candlesticks, EMA20/EMA50 and volume.
Key takeaways
- Solana trades near $72.75 with an intraday bullish structure but a neutral-to-bearish daily macro regime.
- The Fear & Greed Index sits at 12 (Extreme Fear), while BTC dominance holds firm at 55.75%.
- Daily RSI at 51.39 and a positive MACD histogram suggest downside momentum is weakening.
- SOL must close above the $75.50–$76 resistance zone to confirm a macro shift.
- On-chain activity remains strong, with PumpSwap posting a +111% single-day fee increase.
What makes this moment worth watching is the confluence of a recovering short-term trend against a backdrop of Extreme Fear in the broader market. The Fear & Greed Index sits at just 12, while total crypto market cap nudges above $2.15 trillion. BTC dominance holds firm at 55.75%. That is a macro environment where capital is defensive and selective. For Solana to stage a credible rally, it needs the broader market to stop rotating into BTC and stable assets.
The Daily Chart: Recovery Attempt, Not Recovery Confirmed
The daily chart shows a recovery attempt that remains unconfirmed, with SOL hovering just above its 20-day EMA but still below key resistance. The Solana price today closed at $72.71, placing it just above the 20-day EMA at $71.28. That is a modestly constructive sign, but the price remains meaningfully below the 50-day EMA at $75.18. The 200-day EMA at $99.64 is a distant memory, a reminder of how far the asset has fallen from its cycle highs. The current price sits nearly 27% below that long-term average, keeping the macro bias structurally bearish.
The daily RSI at 51.39 sits in no-man’s land. It is above 50, which tilts toward mild bullish momentum, yet it carries none of the conviction expected in a genuine trend reversal. This is a market that has stopped falling, not one that is confidently climbing. Meanwhile, the daily MACD tells a more nuanced story: the line remains negative at -1.06 and the signal at -1.74, meaning the trend is still technically bearish.
However, the histogram has flipped positive at +0.68, showing that downside momentum is losing steam and a crossover may be building. It is a leading hint, not a confirmation.
Bollinger Bands on the daily chart place the midline at $70.29, with the upper band at $75.62 and the lower at $64.97. Price is currently sandwiched between the midline and the upper band — exactly where you want to see it in a recovering market. However, the upper band at $75.62 aligns closely with the 50-day EMA, creating a meaningful resistance cluster. The ATR of 4.04 indicates daily candles are still swinging hard, roughly 5.5% of current price per day. Anyone trading this without respect for volatility is flying blind.
Daily pivot levels place the pivot point at $72.13, R1 resistance at $73.91, and S1 support at $70.93. Price sits right above the PP, suggesting the market is in equilibrium on this timeframe — neither trending confidently up nor breaking down.
The Hourly Structure: Where the Actual Bullish Case Lives
The hourly chart displays a clean bullish structure, with price stacked above all three key EMAs — a rare alignment during genuine downtrends. Shifting to the 1-hour chart, the picture improves notably. The H1 regime is classified as bullish, with price at $72.75 stacked above all three key EMAs. These are the 20 at $71.85, the 50 at $71.45, and the 200-hour EMA at $70.94. That is a clean bullish alignment rarely seen during genuine downtrends, and it indicates that the short-term structure has repaired itself.
The hourly RSI at 60.34 supports this — it is approaching overbought but has not yet hit the level where exhaustion becomes the primary concern. The hourly MACD is positive and aligned: line at +0.32, signal at +0.17, histogram at +0.16. Everything is pointing the same direction on this timeframe, which is encouraging for near-term bulls.
Hourly Bollinger Bands show price near the upper band at $73.08, meaning there is not much room left before the first natural resistance kicks in. The ATR of 1.11 on the hourly gives a sense of expected intraday movement — tight enough to trade, wide enough to respect stops.
The 15-minute chart echoes the same bullish regime, with EMAs stacked in order and an RSI just under 60. The MACD histogram on the 15m has narrowed to just 0.02, suggesting the very short-term momentum is starting to flatten. This is not necessarily bearish — more like a brief consolidation within the broader intraday trend. If you are looking at entry timing, the 15m is showing pause, not reversal.
Solana’s DeFi Ecosystem: Still Generating Real Activity
Solana’s DeFi ecosystem continues to generate substantial on-chain activity, with native DEXes posting significant fee volume spikes. One layer the pure chart does not capture is what is happening on-chain. According to DefiLlama data, Solana-native DEXes continue to generate substantial fee volumes. PumpSwap posted a staggering +111% single-day fee increase, while Orca DEX saw +84% in 24 hours. Both signal a meaningful spike in trading activity.
Meanwhile, Raydium AMM, despite a rough 7-day stretch (-45%), still ranks among the top fee-generating protocols globally. This burst of on-chain activity does not automatically translate to price appreciation. However, it confirms that the Solana ecosystem is alive and seeing genuine user engagement, adding a layer of fundamental support pure price charts miss.
The Bull Case: Momentum Transfers Upward
The bull case requires SOL to hold above the daily 20 EMA and push through the $73.91–$75.62 resistance cluster for any credible macro shift. For the bullish scenario to materialize, the path is relatively clear. SOL needs to hold above the daily 20 EMA ($71.28) on any pullback and push through the resistance cluster between $73.91 (daily R1) and $75.62 (daily upper Bollinger / 50-day EMA). A clean daily close above $75.50 would mark the first genuinely constructive macro shift in weeks and would likely attract momentum buyers who have been sitting on the sidelines.
The MACD histogram turning positive on the daily — already happening — is the kind of early signal that precedes those breakouts when broader market sentiment eventually turns. This scenario gets invalidated quickly if price fails to hold $70.93 (daily S1). A sustained break below $71 would suggest the 20 EMA is offering no real support, and the next structural floor sits all the way back down near the lower Bollinger Band at $64.97.
The Bear Case: Structural Weight Reasserts Itself
The bear case hinges on the Fear-driven macro environment persisting, with BTC dominance above 55% historically suppressing altcoin rallies. By contrast, the bearish scenario does not require a dramatic catalyst — it just requires the current Fear-driven macro environment to persist. BTC dominance above 55% in an Extreme Fear regime historically means altcoins struggle to sustain rallies. Solana, despite its ecosystem strength, is not immune to that dynamic. If the $73.91–$75.62 resistance zone holds and the daily MACD fails to complete its crossover, SOL could easily roll back toward $68–$65.
That range would retest the lower end of the current Bollinger structure and begin raising questions about whether the asset has found a genuine floor at all. This bearish case gets invalidated by a strong close above $76 on meaningful volume, particularly if accompanied by a shift in the broader market Fear & Greed reading above 25. Until then, it remains the path of least resistance on the macro timeframe.
Where Does This Leave Traders?
Traders face a market where both bull and bear cases are technically valid, depending on which timeframe they prioritize. Solana is at one of those frustrating inflection points where both the bull and bear case are technically valid, depending on which timeframe you are standing on. The intraday structure is healthy; the daily structure is cautiously recovering; the macro structure is still broken. Anyone positioning here is taking a view on which of those three realities wins out over the next 72–96 hours.
The ATR profile — $4 on the daily, $1.11 on the hourly — means this is not a low-volatility setup. Stops placed casually will be hit, and position sizing relative to that volatility band matters more than entry price precision. The Extreme Fear reading at 12 historically marks periods of either capitulation bottoms or prolonged grinding lows. It rarely resolves quickly. Any Solana recovery built in this sentiment environment will need to fight for every dollar of upside. Watch the $75.50–$76 zone closely — that level will tell the real story.
FAQ
What is Solana’s price today?
As of June 29, 2026, Solana trades at approximately $72.75, sitting just above its 20-day EMA at $71.28 but below the 50-day EMA at $75.18 and the 200-day EMA at $99.64.
Is Solana’s short-term trend bullish or bearish?
The hourly chart shows a clean bullish alignment, with price above all three key EMAs and an RSI of 60.34. However, the daily macro structure remains neutral-to-bearish, creating a tension between timeframes.
What resistance levels matter most for Solana right now?
The critical resistance cluster sits between $73.91 (daily R1) and $75.62 (daily upper Bollinger Band and 50-day EMA). A daily close above $75.50 would mark the first constructive macro shift in weeks.
What is driving on-chain activity on Solana?
Solana-native DEXes like PumpSwap (+111% single-day fee increase) and Orca DEX (+84%) are seeing significant spikes in trading activity, confirming genuine user engagement across the ecosystem.
Disclaimer: This article is for informational purposes only and does not constitute financial advice, an investment recommendation, or a solicitation to buy or sell any financial instrument or cryptocurrency. The analysis provided is not indicative of future results. Investing in crypto assets and financial markets carries a high risk of capital loss. Always do your own research (DYOR) and consult a qualified financial advisor before making any decision.
Article produced with the assistance of artificial intelligence and reviewed by the editorial team.


You May Also Like

AI spending boom accelerates as Big Tech pours trillions into infrastructure

Polymarket’s $3.3B World Cup boom exposes the longshot trap inside prediction markets