Solana Price Today: DeFi Fees Surge 150% as SOL Holds $74
The crypto market sits deep in Extreme Fear, yet one asset refuses to buckle. As of July 1, 2026, the Solana price today holds near $74.65 — a level that seems modest until you weigh the pressure from above and the support beneath.
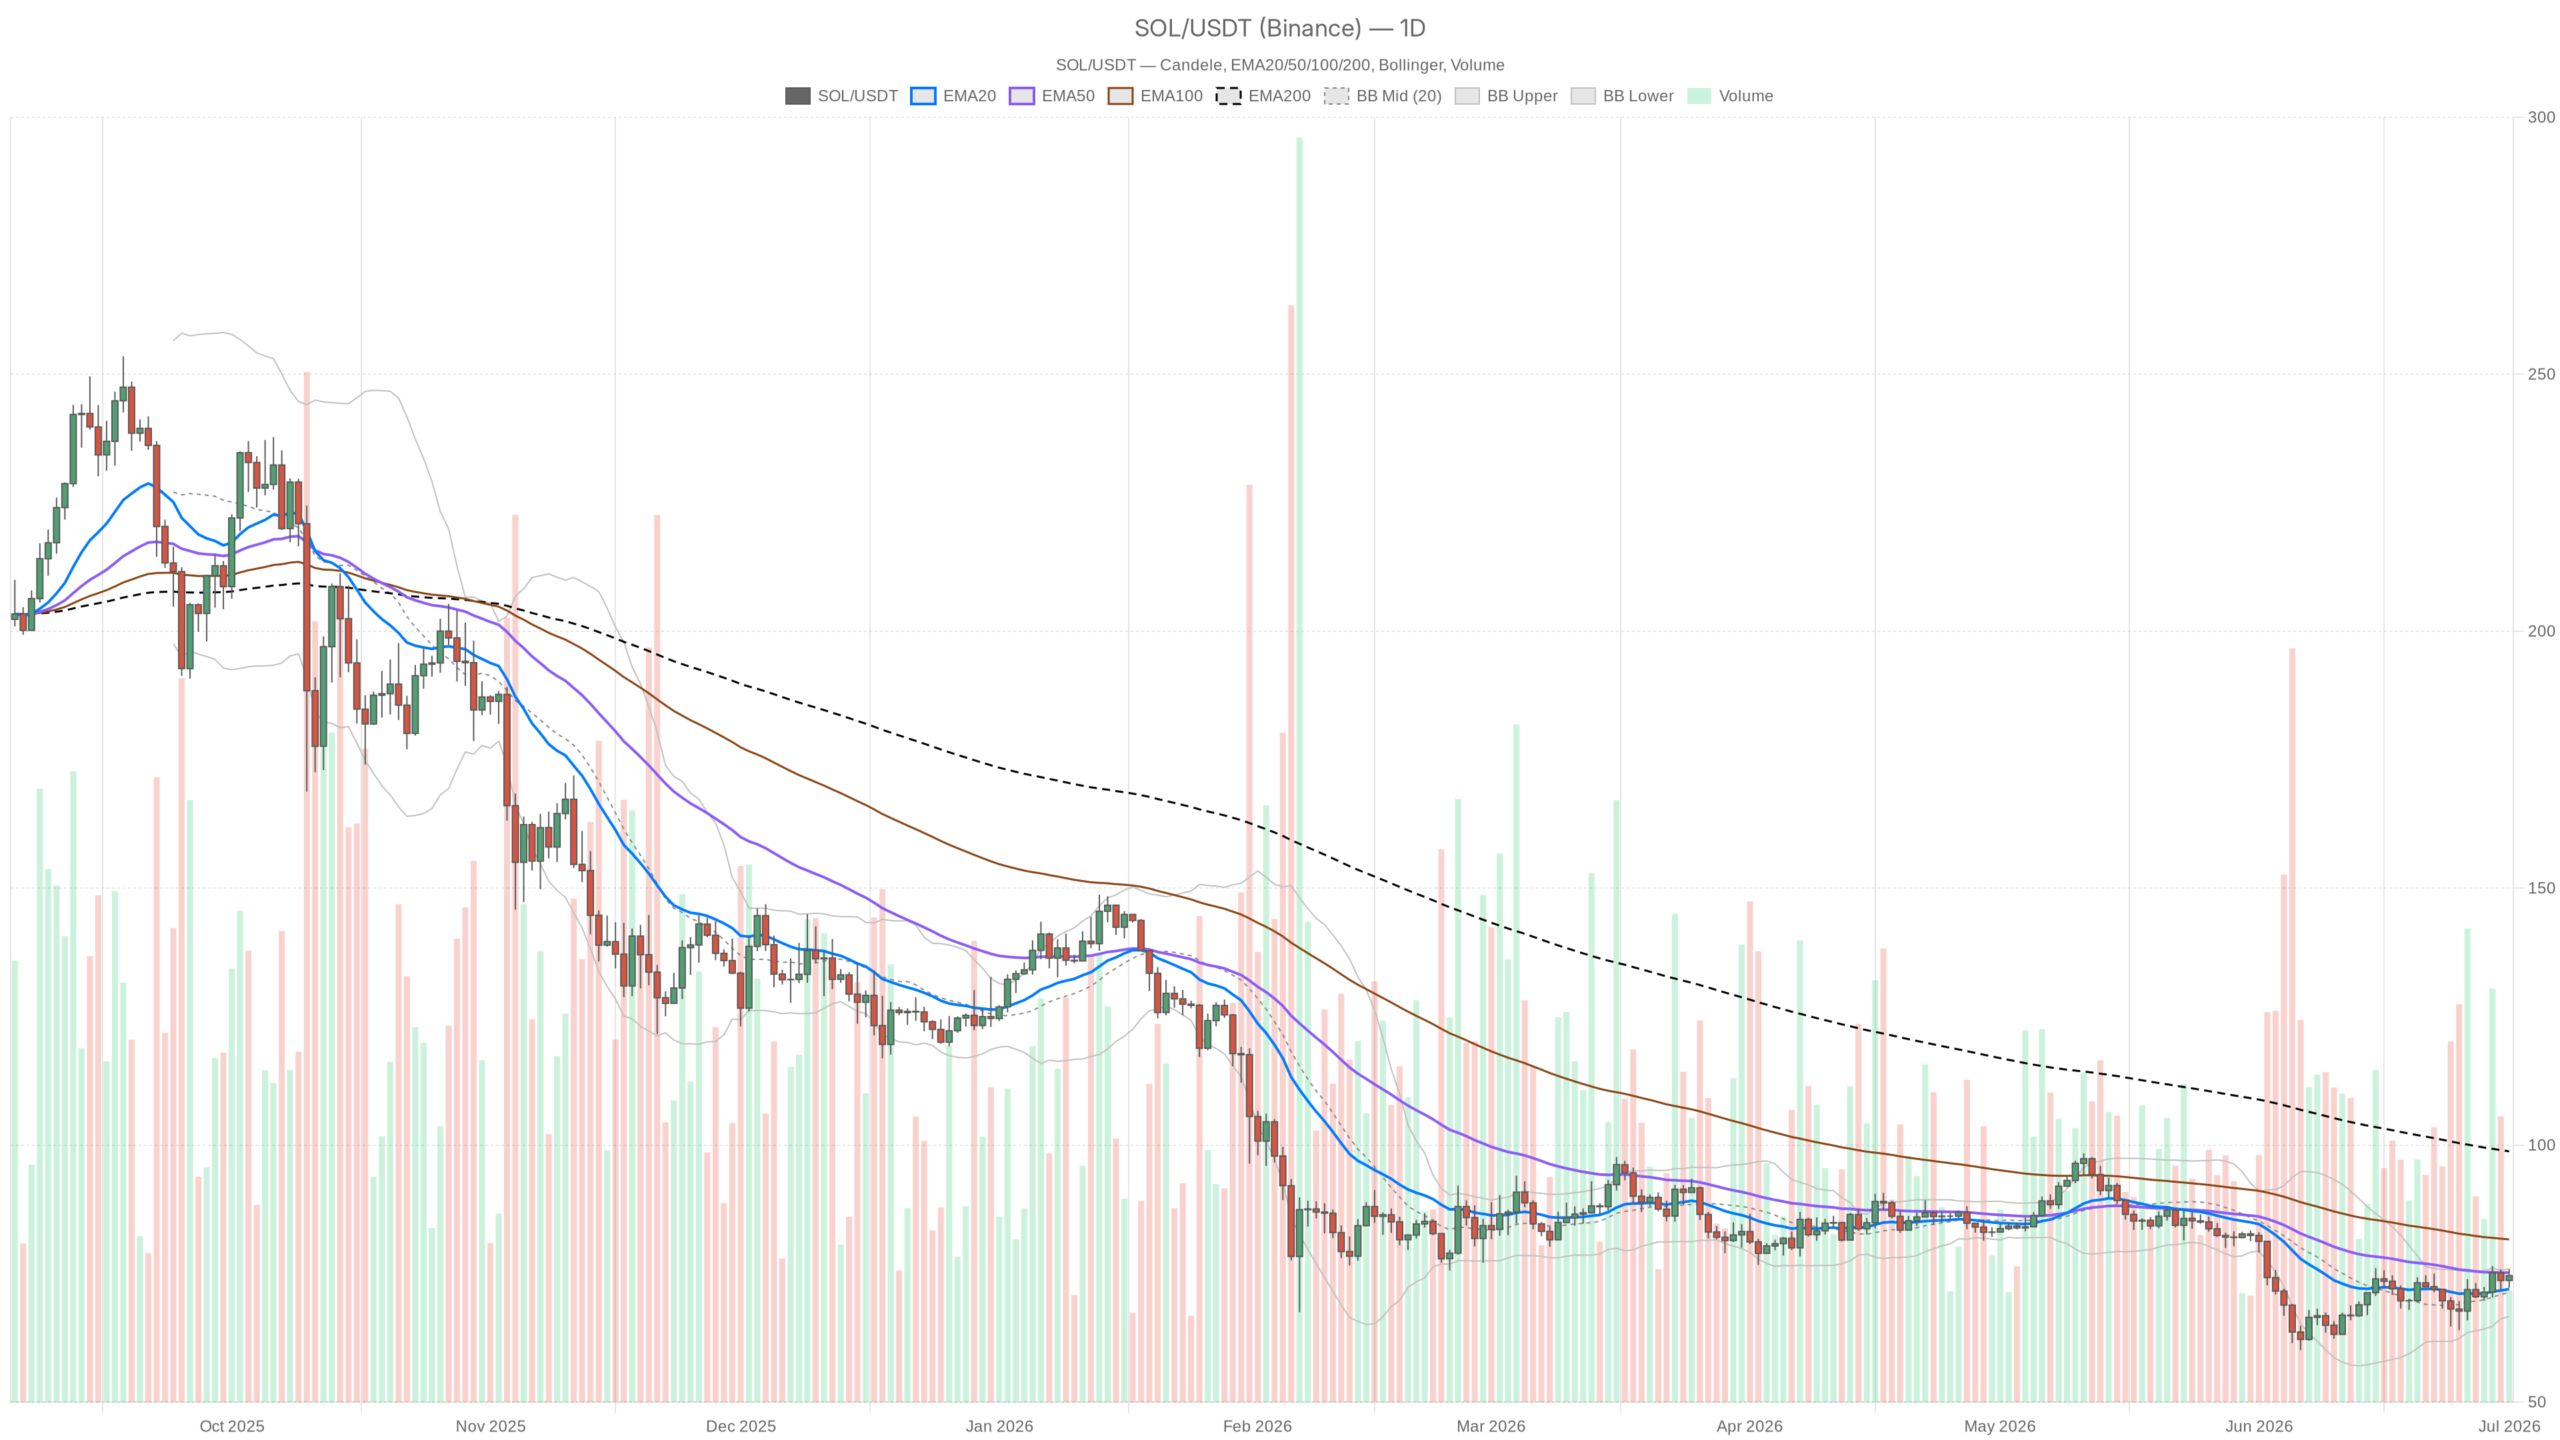 SOL/USDT — daily chart with candlesticks, EMA20/EMA50 and volume.
Key takeaways
- SOL trades near $74.65 while the Fear & Greed Index sits at 11 (Extreme Fear) and total crypto market cap slips past $2.12 trillion.
- The daily chart remains neutral, with the EMA50 at $75.19 acting as the key resistance that must break for bulls to take control.
- The hourly timeframe is the only one flashing a clean bullish signal, with all three EMAs stacked in buyer-aligned order.
- Solana DeFi fees are surging despite flat price action — Orca DEX posted +150% 30-day growth and PumpSwap fees jumped over 40% in a single day.
- A daily close above $75.19 or below $72.62 will determine the next directional move; everything in between is noise.
The dominant force right now is defensive positioning. Investors are not rotating aggressively into altcoins, and Solana is no exception to that gravity. What makes the current moment worth dissecting is the divergence between timeframes. The daily chart sits in no-man’s land, the hourly has quietly flipped bullish, and the 15-minute already shows early signs of exhaustion. That is a setup that rewards patience and punishes reactive trades.
The Daily Picture: Neutral With a Bearish Shadow Overhead
The daily chart paints a neutral picture, but one with a clear bearish shadow hanging directly overhead. SOL closed at $74.62, sitting above the EMA20 at $72.00 yet below the EMA50 at $75.19. That gap is significant: the EMA50 acts as immediate dynamic resistance, and price has not convincingly cleared it. The EMA200 looms far above at $98.80, a reminder of how much ground was lost during the broader market drawdown.
The daily RSI at 54.48 is the most honest signal on this timeframe. It sits above the midline, which keeps the door open for bulls. However, it is not printing the kind of momentum readings that precede breakouts. It is the RSI of a market that is stabilizing, not accelerating.
The MACD on the daily deserves attention precisely because of its internal contradiction. The line sits at -0.33 and the signal at -1.25, which would ordinarily read as bearish. Yet the histogram has turned positive at +0.93. That is the MACD structure improving from the bottom up, even if absolute levels remain negative. The engine is warming up; the car has not moved yet.
Bollinger Bands on the daily place the midline at $71.32, with the upper band at $75.94. Current price is pressing into the upper half of the range and approaching the upper band. It is not stretched, but not coiled either. The ATR of $4.28 signals that a normal daily swing can absorb moves of $4 or more in either direction without violating any structural story. Volatility is present — do not undersize your risk assumptions.
Pivot analysis from CoinGecko-derived data places the daily pivot point at $74.25, with R1 resistance at $76.24 and S1 support at $72.62. SOL is above the pivot, which is a mild positive. The intraday balance of power tilts slightly to buyers at current levels. Moreover, a clean hold above $74.25 through the session would reinforce that read.
The Hourly Chart: The Only Clearly Bullish Timeframe
The hourly chart is the only timeframe flashing a clear bullish signal right now. All three EMAs are stacked in bullish order: EMA20 at $74.23, EMA50 at $73.70, and EMA200 at $71.95. Price at $74.65 sits above all of them. This is clean, unambiguous short-term trend structure. Buyers have controlled this timeframe consistently enough to align every major moving average.
Meanwhile, the 1H RSI at 55.79 echoes the daily reading: positive but not overheated. The MACD on this timeframe is also constructive. The line at $0.33 sits above the signal at $0.21, with a small positive histogram. Momentum on the hourly is in gear, just not at full throttle.
The 1H Bollinger Bands narrow the actionable zone, with the upper band at $75.62 and the lower at $72.08. Current price hugs the upper half of this range, reflecting controlled bullish pressure. If buyers are genuine here, they should defend the $74.24 S1 level on any pullback. That is where the hourly structure would start to crack.
15-Minute: Hesitation at the Short-Term High
The 15-minute chart shows the first signs of hesitation near the short-term high, and it is worth flagging without over-reading it. Price at $74.66 sits marginally below the 15M EMA20 at $74.72. The MACD histogram has flipped negative at -0.13, and the RSI rests dead-flat at 50.53. This is a micro-structure that is stalling — not collapsing, but losing the initiative that carried it to this level.
In the context of higher timeframes, this reads as normal consolidation beneath R1 resistance at $74.79, not as a trend reversal. However, if you are looking for an entry point, the 15-minute is telling you to wait for resolution rather than chase the current level.
DeFi Activity on Solana: The Ecosystem Signal
On-chain activity on Solana tells a different story than the price chart — one of accelerating usage. According to DefiLlama data, PumpSwap posted a +40.15% daily fee surge, with 30-day growth of nearly 50%. Orca DEX posted an eye-catching +150.62% in 30-day fee growth. Raydium shows a 30-day gain of 15% despite a rough week.
The DeFi engine on Solana is not stalling. In fact, it is accelerating at the protocol level even as SOL price languishes in the mid-$70s. That kind of divergence between on-chain activity and token price is historically a setup that resolves upward, though timing is never guaranteed.
Bull Case: What Has to Happen
For bulls to take control, SOL must close a daily candle above the EMA50 at $75.19. That is the key structural unlock. Above there, the next meaningful resistance cluster sits around $75.94 at the daily upper Bollinger Band and $76.24 at daily R1. A break through that zone, confirmed on the hourly with volume, would shift the daily regime from neutral to bullish. Such a move would likely invite momentum players into the trade.
This scenario is invalidated if price rolls back below $72.62 on a closing basis. That kind of move would suggest the EMA50 rejection was real. It would also signal that sellers are reasserting control of the daily range.
Bear Case: Where the Thesis Falls Apart
The bear case does not require a crash — just persistence from sellers at key resistance levels. If SOL continues to fail at the EMA50 and broader market fear deepens, gravity takes over. A daily close below $72.62 opens a path toward the Bollinger midline at $71.32. Ultimately, $70 would act as both a psychological and structural magnet. The EMA20 at $72.00 would get tested, and a failure there removes the last meaningful near-term support layer on the daily.
The bear case is invalidated by a clean daily close above $76.24. That would reframe the recent consolidation as accumulation rather than distribution.
How to Think About Positioning Here
SOL at $74.65 is parked at a genuine decision point that calls for patience over impulse. The hourly structure is healthy, the daily ambiguous, and the macro hostile. The Solana price today at $74.65 represents exactly that tension — not a call to load up, but a signal to manage size and watch for confirmation. The EMA50 on the daily is the line in the sand. Everything else remains noise until that level gets resolved.
Moreover, with an ATR of $4.28 on the daily and Extreme Fear dominating sentiment, the path of least resistance for volatility is expansion rather than compression. That cuts both ways. Traders who need tight stops may find this environment expensive. Those with wider risk tolerance and a thesis anchored in the DeFi activity divergence have a more patient case to make.
FAQ
What is the Solana price today?
As of July 1, 2026, Solana is trading at approximately $74.65, holding above its daily pivot point of $74.25 despite the broader crypto market being gripped by Extreme Fear with a reading of just 11 on the Fear & Greed Index.
What is the key resistance level for SOL right now?
The EMA50 on the daily chart at $75.19 is the critical resistance to watch. A daily close above that level would shift the regime from neutral to bullish and likely invite momentum buyers into the trade, with the next target zone around $75.94 to $76.24.
Is Solana DeFi activity still growing?
Yes. According to DefiLlama data, PumpSwap fees surged over 40% in a single day, and Orca DEX posted 30-day fee growth above 150%. On-chain usage is accelerating at the protocol level even as the SOL token price consolidates in the mid-$70s.
What happens if SOL drops below $72.62?
A daily close below $72.62 (S1 support) would invalidate the near-term bullish structure and open a path toward the Bollinger midline at $71.32, with the $70 round number acting as the next psychological and structural magnet for price.
SOL sits at a crossroads defined by the EMA50 at $75.19 on the upside and S1 support at $72.62 on the downside. With an ATR of $4.28 and Extreme Fear gripping the broader market, volatility expansion is the path of least resistance. Traders anchored in the DeFi activity divergence have a patient case to make, while those requiring tight stops may find this environment costly. Confirmation, not anticipation, is the operative word.
&
Disclaimer: This article is for informational purposes only and does not constitute financial advice, an investment recommendation, or a solicitation to buy or sell any financial instrument or cryptocurrency. The analysis provided is not indicative of future results. Investing in crypto assets and financial markets carries a high risk of capital loss. Always do your own research (DYOR) and consult a qualified financial advisor before making any decision.
Article produced with the assistance of artificial intelligence and reviewed by the editorial team.


You May Also Like

BlackRock Transfers $212M in Bitcoin to Coinbase, Signaling ETF Activity

Belgium vs Senegal Tactical Preview: World Cup 2026 Game Plan, Key Battles and Match Prediction