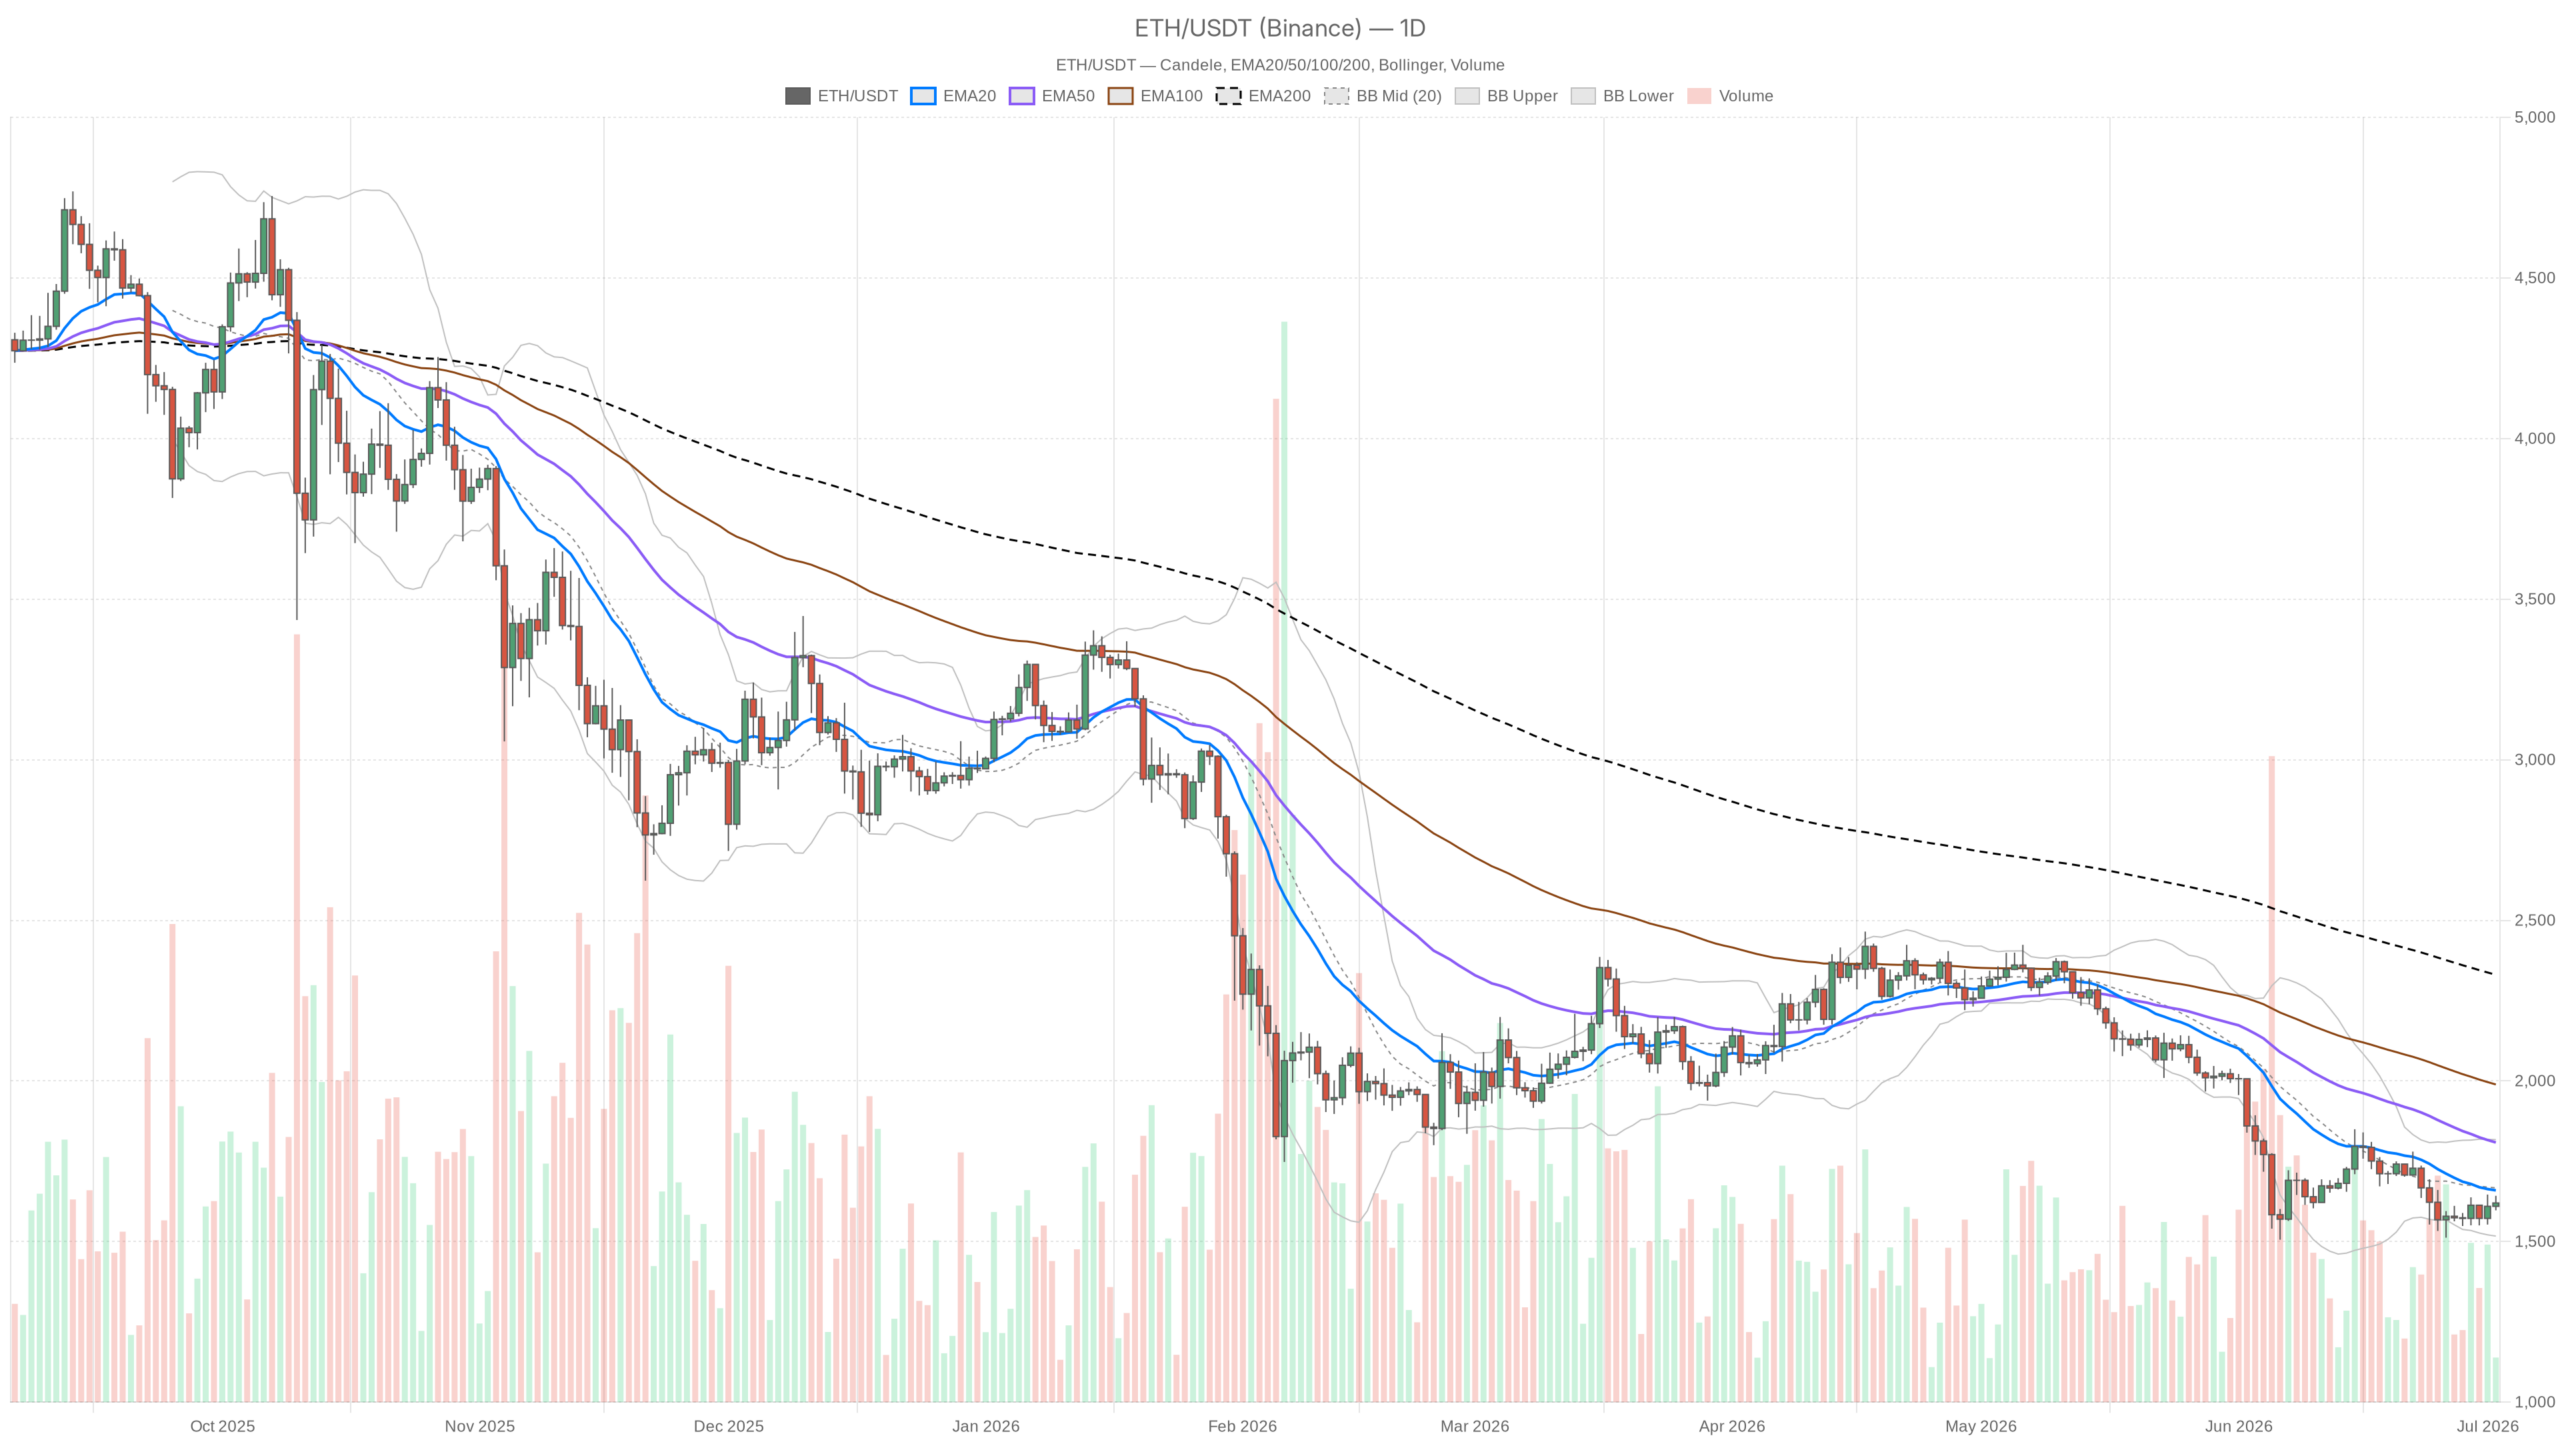
Ethereum Price Today: ETH 30% Below 200-Day Average at $1,620

Market data from July 2, 2026 places the Ethereum price today near $1,620, as bearish momentum continues to dominate the daily chart. ETH has shed roughly 30% from its 200-day EMA and now trades below every major moving average that long-term participants watch closely.
 ETH/USDT — daily chart with candlesticks, EMA20/EMA50 and volume.
Key takeaways
- ETH trades at $1,620, down 30% from its 200-day EMA of $2,330
- Daily RSI at 40.96 signals a downtrend without capitulation extremes
- Fear & Greed Index at 19 reflects deep Extreme Fear across the market
- Daily ATR of 73.45 means any given session can swing $70 or more
- Bitcoin dominance at 55.6% confirms no meaningful rotation into altcoins
The Daily Timeframe: A Bear Market in Plain Sight
The daily chart for Ethereum shows a firmly bearish regime with price trapped below all three major moving averages. ETH closed at $1,620.01, sitting below its 20-day EMA at $1,659, the 50-day EMA at $1,808, and dramatically below the 200-day EMA at $2,330. That stacking of price under all three averages in descending order is about as clean a bearish configuration as possible. Each of those EMAs now acts as overhead resistance. The gap to the 200-day alone implies that any meaningful recovery would demand a multi-week sustained effort.
The daily RSI at 40.96 sits below the midline, consistent with a downtrend, yet not at the extreme lows where capitulation bounces typically emerge. This is the uncomfortable middle ground: oversold enough to feel heavy, but not distressed enough to signal a flush. Moreover, the MACD remains in negative territory with the line at -66.62 and the signal at -74.46, though the histogram has ticked to +7.84. That small positive reading suggests the rate of bearish momentum is decelerating. It is not a reversal signal, but at minimum a sign sellers are pressing less aggressively than before.
Bollinger Band positioning reinforces the thesis. Price at $1,620 sits in the lower half of the band, with the midline at $1,667 and the lower band at $1,517. This indicates the path of least resistance remains to the downside. Meanwhile, the lower band offers a rough floor on how far an uninterrupted sell-off can stretch without some mean-reversion snap. The daily ATR of 73.45 means any given session can swing $70 or more. This creates a high-noise environment where positioning around specific levels carries genuine risk.
The Hourly Chart: A Flicker of Short-Term Life
In contrast to the daily picture, the 1-hour timeframe offers a mildly constructive outlook. Price at $1,619.65 is trading above all three hourly EMAs — the 20 at $1,614.91, the 50 at $1,602.21, and the 200 at $1,607.71. That short-term EMA alignment stands in direct opposition to the daily trend. The hourly RSI at 54.51 is the strongest reading across all three timeframes, suggesting that intraday buyers have managed to reclaim some ground.
However, the MACD on the 1H tells a more cautious story. The line at 8.22 is above the signal at 9.40, but the histogram at -1.18 has just tipped negative. This typically means the short-term momentum pulse is already fading. Meanwhile, the hourly Bollinger Bands place price near the midline at $1,618.47, suggesting neither expansion nor compression — the market is pausing, not building. Pivot points have R1 at $1,622.68 and S1 at $1,615.85, a range so tight it barely qualifies as a battlefield. These are granular levels useful only for very short-term execution.
The 15-Minute: No Clear Setup
The 15-minute timeframe confirms that the very near-term has stalled. Price at $1,619.51 is below its 20-period EMA at $1,622.48, and the MACD is printing a negative histogram of -1.71 with both line and signal crossed bearishly. The RSI at 45.88 sits just below neutral. Combined, this suggests the micro-structure is softening after the brief intraday pop visible on the hourly chart. For traders looking at entries, the 15-minute gives no clean setup — it reads as directionless chop within a broader downtrend.
DeFi Context: Activity Without ETH Price Tailwinds
On-chain DEX activity, per DefiLlama data, shows Uniswap V3 daily fees spiking 47% in the last 24 hours, while the emerging Ekubo protocol posted a staggering 193% single-day fee jump. This level of activity normally implies increased on-chain volume and engagement. Yet it has not translated into any visible ETH price premium, and that disconnect is meaningful. When DeFi activity rises and ETH price fails to follow, it often signals that the activity is driven by volatility arbitrage or liquidations rather than fresh capital deployment. In short, it is engagement born of stress, not optimism.
Bullish Scenario
For a genuine bullish case to develop, ETH needs to convincingly reclaim the $1,659 level — the 20-day EMA — and hold it on a daily close. That would represent the first real structural shift in the near-term trend. From there, the $1,667 Bollinger midline and the $1,808 50-day EMA become the next meaningful targets, though neither should be assumed automatic. The daily MACD histogram turning positive and expanding would serve as a key secondary confirmation. Until that sequence materializes, any intraday rally is a relief move inside a downtrend, not a reversal.
Conversely, this scenario gets invalidated quickly if price fails to sustain above the daily pivot at $1,619.85 and slides back toward S1 at $1,597.38 on a closing basis. Losing $1,597 with conviction would suggest that absorption is failing.
Bearish Scenario
The path of least resistance remains lower. A failure to hold the $1,597 daily S1 opens the door to a test of the lower Bollinger Band at $1,516.96 — a level that has not been tagged recently and could attract both stop-runs and opportunistic longs. Below that, there is limited technical support until the $1,400–1,450 region. The daily ATR of $73 means such a move could unfold in two to three sessions without requiring any extraordinary catalyst. The bearish case stays intact as long as price respects the 20-day EMA as resistance on any bounce attempts.
This scenario breaks down if a daily close above $1,660–1,670 arrives with expanding volume and a momentum follow-through on the MACD. That outcome would force a reassessment of the short-term bias.
Where Does This Leave Positioning?
The Ethereum price today reflects a market trapped between competing timeframes: the daily is firmly bearish with no structural repair in sight, while the hourly is marginally constructive but fading. Anyone trying to catch a bottom here is fighting the dominant trend with only short-term, low-conviction evidence on their side. That does not mean it cannot be done — it means the risk-reward calculus has to be extremely disciplined. Tight stops, defined levels, and no assumption that a multi-month downtrend reverses in a single session are essential.
The Fear & Greed Index reading of 19 historically correlates with periods of indiscriminate selling and capitulation risk. It is the kind of environment where real opportunities eventually emerge — but often after one more leg of pain forces out the last reluctant holders. Volatility, as measured by the daily ATR, is elevated enough to make position sizing a serious consideration. This is not a market for guessing. It is a market for waiting on confirmation.
FAQ
Where is ETH trading right now?
As of July 2, 2026, Ethereum is trading near $1,620, roughly 30% below its 200-day EMA of $2,330. The daily chart remains firmly bearish with price below all major moving averages.
Is Ethereum in a bear market right now?
Yes. The daily timeframe shows ETH trading below the 20-day, 50-day, and 200-day EMAs in descending order — a textbook bearish configuration. The Fear & Greed Index at 19 further confirms extreme bearish sentiment across the market.
What levels should traders watch for a potential reversal?
A convincing daily close above $1,659 — the 20-day EMA — would represent the first structural shift needed for a bullish reversal. Beyond that, the $1,667 Bollinger midline and the $1,808 50-day EMA become the next meaningful targets to monitor.
&
Disclaimer: This article is for informational purposes only and does not constitute financial advice, an investment recommendation, or a solicitation to buy or sell any financial instrument or cryptocurrency. The analysis provided is not indicative of future results. Investing in crypto assets and financial markets carries a high risk of capital loss. Always do your own research (DYOR) and consult a qualified financial advisor before making any decision.
Article produced with the assistance of artificial intelligence and reviewed by the editorial team.


You May Also Like

'You’re seeing it burn to the ground': Steve Bannon has a major warning for GOP insiders
Cango Inc. Completes $65M Investment and Secures $10M Convertible Note Financing