

Solana Price Forecast: SOL Eyes Elliott Wave 5 Rally to $1,200
Solana is trading near $83 this week. The token slipped a little, down about 3% on the day, even as new real-world use cases for the network keep showing up.
Let's discuss the Solana Price Forecast.
Is Solana price going up or down right now?
SOL sits close to $83.07 at the time of writing. It briefly touched near $84 before pulling back. The move is small, but it comes at a spot on the chart that traders are watching closely.
A liquidation map for SOL shows two key zones near the current price. Around $80 to $81, there is a large cluster of long positions that could get liquidated if price drops there.
Just above, near $84.5 to $85, short positions could get squeezed if price pushes up through that level.
That means the next move, up or down, may happen with some speed. Liquidation clusters tend to add fuel once price reaches them.
Still, a map like this shows where volatility might happen. It does not tell us which way price will actually go.
For anyone tracking a Solana Price Forecast this week, these two zones are worth watching closely.
What does the Elliott Wave chart say about Solana's next move?
Some chart watchers are mapping Solana's price history using Elliott Wave theory. This is a method that looks for repeating wave patterns in price charts.
Under one such count, Solana finished a five-leg impulse move from 2021 to 2022, then fell in an A-B-C correction into the 2022 bottom. From there, a new five-leg impulse move started.
On the weekly chart, waves (1) through (4) may already be done, with wave (4) bottoming out near current levels. If this reading holds, the final bullish leg could still be ahead.
Some chart projections stretch as far as $1,200, based on Fibonacci extension levels near the 4.764 mark.
There is also an "invalidation" zone marked lower on the chart, roughly in the $30 to $75 range. If SOL fell into that zone, it would break this wave count entirely.
It is worth saying clearly: this is one technical theory, not a guarantee. Elliott Wave counts can be redrawn as new price data comes in.
Why is Solana getting more attention this week?
Away from the charts, SOL had real news this week. The Solana Foundation announced a partnership with MoonPay tied to the World Series of Poker.
Players will be able to buy into tournaments using SOL, and can also receive winnings in stablecoins.
This adds to a bigger trend. Onchain payment volume on $SOL rose 87% year over year. Card payments alone processed about $420 million, five times more than last year.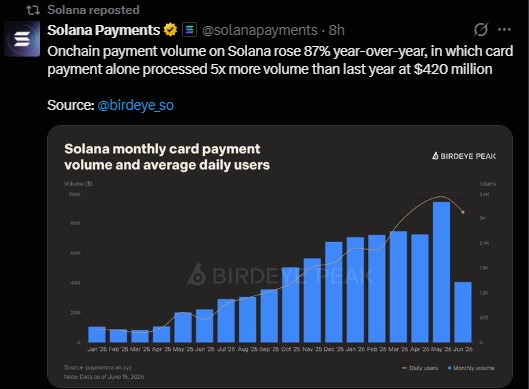
More than 3.77 billion non-vote transactions happened on the network in June alone.
|
Metric |
Figure |
|
SOL price |
$83.07 |
|
24h change |
-3.23% |
|
Long liquidation cluster |
$80-$81 |
|
Short liquidation cluster |
$84.5-$85 |
|
Onchain payment volume (YoY) |
+87% |
|
Card payment volume |
$420M (5x YoY) |
|
June non-vote transactions |
3.77B+ |
Could Solana reach $1,200 in this cycle?
That number comes from one Elliott Wave projection, not a set target. It sits at a Fibonacci extension level often used in this kind of chart reading.
Any Solana Price Forecast 2026 built on wave counts should be treated as one possible path, not a fixed outcome.
SOL would need to clear several resistance levels first, including the prior high near $285 and the wave (3) peak. Real usage growth, like the payment volume increase, may support demand over time.
But short-term price swings will likely keep tracking liquidation zones and overall crypto market mood.
Comparing SOL to other large-cap tokens
The table below shows how SOL stacks up against another token trading in a similar price range this week.
|
Token |
Price |
24h High |
24h Low |
24h Change |
|
SOL |
$83.07 |
$83.994 |
$80.39 |
-3.23% |
|
HYPE |
$71.135 |
$72.13 |
$69.115 |
-2.84% |
Disclaimer
This article is for informational purposes only and does not constitute financial, investment, or trading advice. Cryptocurrency markets are highly volatile and prices can rise or fall sharply within short periods. Always do your own research and consult a licensed financial advisor before making any investment decisions.


You May Also Like
Kraken Enables Tokenized Stock Collateral for Leveraged Trades

Lawyers remain in disbelief over ‘fascist Hellscape’ July 4 display in DC

LIST: Bayanihan initiatives amid soaring oil prices


