

Crypto Price Prediction for Today, July 7: Cardano (ADA), XRP, and Dogecoin (DOGE)
Cardano, XRP, and Dogecoin have all entered an important phase after several days of price weakness. Each asset now sits close to key technical levels that could decide whether buyers regain control or sellers extend the recent decline. Today’s price action deserves close attention because a break above or below these support and resistance zones could shape the next move across the broader crypto market.
A closer look at the ADA price, XRP price, and DOGE price charts shows three different market structures. Cardano is testing a support level that has held for several days, XRP has already slipped beneath one important support, and Dogecoin remains trapped inside a narrow trading range.
Cardano (ADA) Price Is Testing A Key Support That Could Decide The Next Move
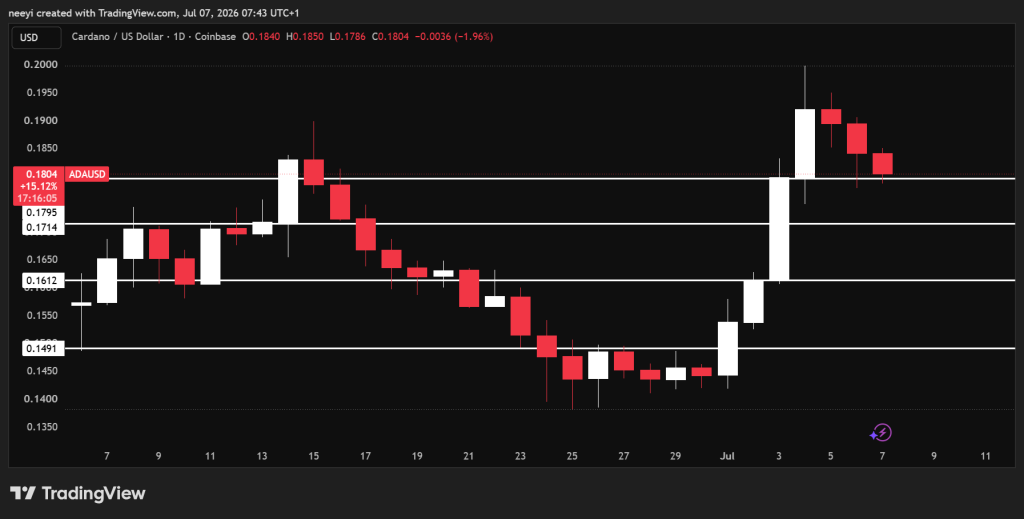
Cardano enjoyed a brief rally before sellers stepped back into the market. The ADA price has closed lower during the past 2 days and remains under pressure today. Current price action shows Cardano attempting to hold support around $0.18, a level that has prevented further losses over the past 3 days.
Today’s trading session could become important for the short-term outlook. Successful defense of this area could allow the ADA price to recover toward $0.179. That move would indicate buyers still have enough strength to challenge recent selling pressure.
 ADAUSD Price Chart / TradingView.com
Failure to defend this support would paint a different picture. A move below $0.179 could open the door to $0.171. Extra selling below $0.171 would weaken the technical outlook further and expose Cardano to a possible decline toward $0.16.
Current indicators present a mixed picture. The Relative Strength Index (RSI) stands at 50.12, which places Cardano almost exactly in the middle of its momentum range. That reading shows neither buyers nor sellers currently dominate price action.
The Momentum indicator has slipped into negative territory at -0.0096. That result points to weakening buying pressure during recent sessions.
The MACD remains positive at 0.0039, although recent movement indicates bullish momentum has faded considerably compared with earlier sessions.
Bull Bear Power sits at -0.0073. That small negative reading shows sellers currently have a slight advantage, although the difference remains relatively limited.
| Name Of Indicator | Metrics | Interpretation Of Metrics |
|---|---|---|
| Relative Strength Index (14) | 50.1221 | Momentum remains balanced with neither buyers nor sellers in full control. |
| Momentum (10) | -0.0096 | Buying pressure has weakened during recent sessions. |
| MACD Level (12, 26) | 0.0039 | Previous bullish strength has faded and upside momentum has slowed. |
| Bull Bear Power | -0.0073 | Sellers hold a slight advantage over buyers. |
Cardano (ADA) Price Prediction for Today
- Bullish Scenario: If the ADA price successfully defends the $0.18 support level today, buyers could regain control. That could allow Cardano to recover toward $0.179 and improve the short term outlook.
- Neutral Scenario: If the ADA price remains above $0.18 but cannot break higher, Cardano could continue trading close to current levels as buyers and sellers remain evenly matched.
- Bearish Scenario: A break below $0.179 would increase selling pressure and expose $0.171 as the next downside target. Extra weakness below $0.171 could open the door for a decline toward $0.16.
XRP Price Has Slipped Below Support And Is Now Testing Another Critical Level
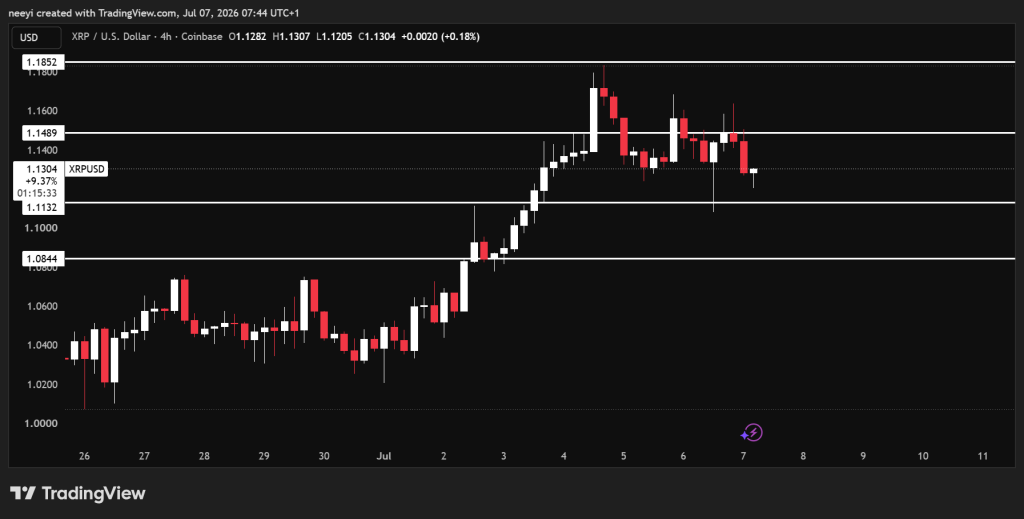
XRP has also struggled during the past 3 days after reaching a recent high near $1.18. The XRP price has already fallen beneath support around $1.148. Current trading now places attention on the next important support near $1.11.
That level could become today’s biggest technical test. Continued buying above $1.11 would help stabilize the recent decline. Failure to defend that area could push the XRP price toward $1.08.
 XRPUSD Price Chart / TradingView.com
Technical indicators continue to show cautious conditions. The RSI stands at 49.37, which keeps momentum almost perfectly balanced between buyers and sellers.
The Momentum reading of -0.00975 points to continued weakness after the recent decline.
The MACD stands at 0.00922. Recent movement indicates bullish momentum has cooled even though the indicator remains above zero.
Bull Bear Power comes in at -0.02595, which shows sellers currently have more influence over short term price movement.
| Name Of Indicator | Metrics | Interpretation Of Metrics |
|---|---|---|
| Relative Strength Index (14) | 49.37243 | Momentum remains balanced without a clear directional advantage. |
| Momentum (10) | -0.00975 | Selling pressure has strengthened during recent sessions. |
| MACD Level (12, 26) | 0.00922 | Earlier bullish momentum has weakened considerably. |
| Bull Bear Power | -0.02595 | Sellers currently maintain stronger control over price action. |
A bullish outcome would require XRP to remain above $1.11 before attempting another recovery. A neutral outcome would keep the XRP price trading between $1.11 and $1.148. A bearish outcome would begin after a break below $1.11, which could allow the XRP price to fall toward $1.08.
XRP Price Prediction for Today
- Bullish Scenario: If the XRP price holds above $1.11, buyers could stabilize the recent decline and attempt a recovery back toward $1.148.
- Neutral Scenario: XRP may continue trading between $1.11 and $1.148 if neither buyers nor sellers gain clear control during today’s session.
- Bearish Scenario: A break below $1.11 would strengthen the bearish outlook and could send the XRP price toward $1.08.
Dogecoin (DOGE) Price Remains Locked Inside A Narrow Trading Range
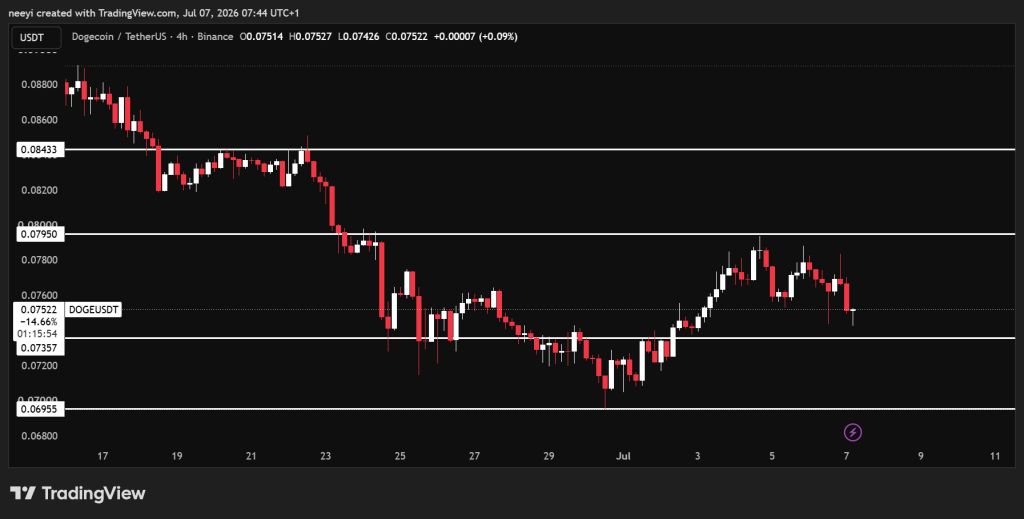
Dogecoin has traded inside a well-defined range between $0.079 and $0.073 during the past 5 days. That range continues to contain price movement, although a breakout could arrive soon.
Support at $0.073 remains the key level to watch. A move beneath that price could send the DOGE price toward $0.069 and strengthen the bearish outlook.
 DOGEUSD Price Chart / TradingView.com
Resistance at $0.079 continues to cap every recovery attempt. A breakout above that ceiling would improve the technical picture and could allow Dogecoin to climb toward $0.084.
Current indicators show buying strength remains limited. The RSI sits at 42.26, which places momentum below the midpoint without entering oversold territory.
The Momentum reading of -0.00221 shows buyers have lost strength during recent sessions.
The MACD stands at 0.00015. That reading points to very limited bullish momentum as price continues to move sideways.
Bull Bear Power comes in at -0.00323, which gives sellers only a slight advantage.
| Name Of Indicator | Metrics | Interpretation Of Metrics |
|---|---|---|
| Relative Strength Index (14) | 42.25872 | Momentum remains below the midpoint and buying strength is limited. |
| Momentum (10) | -0.00221 | Recent price action shows weakening buying pressure. |
| MACD Level (12, 26) | 0.00015 | Bullish momentum remains very limited. |
| Bull Bear Power | -0.00323 | Sellers hold a small advantage over buyers. |
Dogecoin (DOGE) Price Prediction for Today
- Bullish Scenario: A breakout above the $0.079 resistance could allow the DOGE price to extend its recovery and target $0.084.
- Neutral Scenario: Dogecoin may continue moving between $0.073 and $0.079 if neither support nor resistance gives way today.
- Bearish Scenario: A move below $0.073 would weaken the technical outlook and could send the DOGE price toward $0.069.
FAQs
Subscribe to our YouTube channel for daily crypto updates, market insights, and expert analysis.
The post Crypto Price Prediction for Today, July 7: Cardano (ADA), XRP, and Dogecoin (DOGE) appeared first on CaptainAltcoin.


You May Also Like

The Dr. Bob Martin Show Rebrands as Health Talk America, Expanding Its Reach After 30 Years

Metaplanet buys 5,075 Bitcoin in Q1 to become 3rd-largest treasury

Micron and Ford Stocks Climb After Companies Announce Long-Term Semiconductor Supply Partnership



