This study evaluates a transformer-based framework for detecting anomalies in large-scale system logs. Experiments were conducted on four public datasets—HDFS, BGL, Spirit, and Thunderbird—using adaptive log-sequence generation to handle varying sequence lengths and data rates. The model architecture includes two transformer encoder layers with multi-head attention and was optimized using AdamW and OneCycleLR. Implemented in PyTorch and trained on an HPC system, the setup demonstrates an efficient and scalable approach for benchmarking log anomaly detection methods.This study evaluates a transformer-based framework for detecting anomalies in large-scale system logs. Experiments were conducted on four public datasets—HDFS, BGL, Spirit, and Thunderbird—using adaptive log-sequence generation to handle varying sequence lengths and data rates. The model architecture includes two transformer encoder layers with multi-head attention and was optimized using AdamW and OneCycleLR. Implemented in PyTorch and trained on an HPC system, the setup demonstrates an efficient and scalable approach for benchmarking log anomaly detection methods.

How Transformer Models Detect Anomalies in System Logs

2025/11/04 01:52

Abstract

1 Introduction

2 Background and Related Work

2.1 Different Formulations of the Log-based Anomaly Detection Task

2.2 Supervised v.s. Unsupervised

2.3 Information within Log Data

2.4 Fix-Window Grouping

2.5 Related Works

3 A Configurable Transformer-based Anomaly Detection Approach

3.1 Problem Formulation

3.2 Log Parsing and Log Embedding

3.3 Positional & Temporal Encoding

3.4 Model Structure

3.5 Supervised Binary Classification

4 Experimental Setup

4.1 Datasets

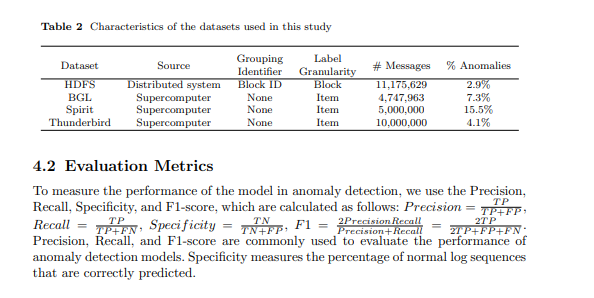
4.2 Evaluation Metrics

4.3 Generating Log Sequences of Varying Lengths

4.4 Implementation Details and Experimental Environment

5 Experimental Results

5.1 RQ1: How does our proposed anomaly detection model perform compared to the baselines?

5.2 RQ2: How much does the sequential and temporal information within log sequences affect anomaly detection?

5.3 RQ3: How much do the different types of information individually contribute to anomaly detection?

6 Discussion

7 Threats to validity

8 Conclusions and References

\

4 Experimental Setup

4.1 Datasets We evaluate our proposed approach and conduct experiments with four commonlyused public datasets: HDFS [8], Blue Gene/L (BGL), Spirit, and Thunderbird [32]. These datasets are commonly used in existing studies [1, 5, 12]. The HDFS dataset [8] is derived from the Amazon EC2 platform. The dataset comprises over 11 million log events, each linked to a block ID. This block ID allows us to partition the log data into sessions. The annotations are block-wise: each session is labeled as either normal or abnormal. In total, there are 575,061 log sessions, with 16,838 (2.9%) identified as anomalies. The BGL, Spirit, and Thunderbird datasets are recorded from supercomputer systems, from which they are named. Different from the HDFS dataset, all these datasets have log item-wise annotation. However, there is no block ID or other identifier to group the log items into sequences. The BGL dataset is recorded with a time span of 215 days, containing 4,747,963 log items, where 348,460 (7.3%) are labeled as anomalies. As the Spirit and Thunderbird datasets each contain more than 200 million log items, which is too large to process, we use subsets of 5 million and 10 million log items, respectively, as per the practices of previous works [7, 11, 15]. We split the datasets into an 80% training set and a 20% test set. For the HDFS dataset, we randomly shuffle the sessions to perform dataset splitting. For the remaining datasets, we divide them in accordance with the chronological order of logs. The summarised properties of datasets utilized in the evaluation and experiment of our study are presented in Table 2.

\

4.3 Generating Log Sequences of Varying Lengths

Except for the HDFS dataset, which has a block ID to group the logs into sequences, other datasets employed by our study have no identifier to group or split the whole log sequence into sub-sequences. In practice, the logs produced by systems and applications do not adhere to a fixed rate of generation. Using fixed-window or fixed-time grouping with a sliding window fails to adequately accommodate the variability in log generation and thus may lead to inaccurate detection of anomalies in real scenarios. Moreover, according to previous studies [1, 7, 15], the best grouping setting varies depending on the dataset, and these settings can significantly influence the performance of the anomaly detection model, making it challenging to compare the effectiveness of different anomaly detection methods. Therefore, we use a method to generate log sequences with varying lengths and utilize these sequences to train the model within our anomaly detection framework. In the process of log sequence generation, we determined specific parameters, including minimum and maximum sequence lengths, as well as a designated step size. The step size is used to control the interval of the first log events in log sequences. The length of each log sequence is randomly generated in the range of the minimum and the maximum length. We assume the log sequence of the minimum length can offer a minimum context for a possible anomaly. The step size controls the overlaps of sequences. The maximum length affects the number of parameters in the model, and step size decides the amount of samples in the dataset. They should be aligned with the data distribution and computational resources available. In the experiments conducted in this study, we set the minimum length as 128, the maximum length as 512, and the step size as 64 for the datasets without a grouping identifier.

\ 4.4 Implementation Details and Experimental Environment

In our experiments, the proposed transformer-based anomaly detection model has two layers of the transformer encoder. The number of attention heads is 12, and the dimension of the feedforward network layer within each transformer block is set to 2048. We use AdamW with an initial learning rate of 5e-4 as the optimization algorithm and employ the OneCycleLR learning rate scheduler to enable a better convergence. We selected these hyperparameters following standard practices while also considering computational efficiency. Our implementation is based on Python 3.11 and PyTorch 2.2.1. All the experiments are run on a high-performance computing (HPC) system. We use a computational node equipped with an Intel Gold 6148 Skylake @ 2.4 GHz CPU, 16GB RAM and an NVIDIA V100 GPU to run our experiments.

:::info Authors:

  1. Xingfang Wu
  2. Heng Li
  3. Foutse Khomh

:::

:::info This paper is available on arxiv under CC by 4.0 Deed (Attribution 4.0 International) license.

:::

\

Disclaimer: The articles reposted on this site are sourced from public platforms and are provided for informational purposes only. They do not necessarily reflect the views of MEXC. All rights remain with the original authors. If you believe any content infringes on third-party rights, please contact service@support.mexc.com for removal. MEXC makes no guarantees regarding the accuracy, completeness, or timeliness of the content and is not responsible for any actions taken based on the information provided. The content does not constitute financial, legal, or other professional advice, nor should it be considered a recommendation or endorsement by MEXC.

You May Also Like

Crucial US Stock Market Update: What Wednesday’s Mixed Close Reveals

Crucial US Stock Market Update: What Wednesday’s Mixed Close Reveals

BitcoinWorld Crucial US Stock Market Update: What Wednesday’s Mixed Close Reveals The financial world often keeps us on our toes, and Wednesday was no exception. Investors watched closely as the US stock market concluded the day with a mixed performance across its major indexes. This snapshot offers a crucial glimpse into current investor sentiment and economic undercurrents, prompting many to ask: what exactly happened? Understanding the Latest US Stock Market Movements On Wednesday, the closing bell brought a varied picture for the US stock market. While some indexes celebrated gains, others registered slight declines, creating a truly mixed bag for investors. The Dow Jones Industrial Average showed resilience, climbing by a notable 0.57%. This positive movement suggests strength in some of the larger, more established companies. Conversely, the S&P 500, a broader benchmark often seen as a barometer for the overall market, experienced a modest dip of 0.1%. The technology-heavy Nasdaq Composite also saw a slight retreat, sliding by 0.33%. This particular index often reflects investor sentiment towards growth stocks and the tech sector. These divergent outcomes highlight the complex dynamics currently at play within the American economy. It’s not simply a matter of “up” or “down” for the entire US stock market; rather, it’s a nuanced landscape where different sectors and company types are responding to unique pressures and opportunities. Why Did the US Stock Market See Mixed Results? When the US stock market delivers a mixed performance, it often points to a tug-of-war between various economic factors. Several elements could have contributed to Wednesday’s varied closings. For instance, positive corporate earnings reports from certain industries might have bolstered the Dow. At the same time, concerns over inflation, interest rate policies by the Federal Reserve, or even global economic uncertainties could have pressured growth stocks, affecting the S&P 500 and Nasdaq. Key considerations often include: Economic Data: Recent reports on employment, manufacturing, or consumer spending can sway market sentiment. Corporate Announcements: Strong or weak earnings forecasts from influential companies can significantly impact their respective sectors. Interest Rate Expectations: The prospect of higher or lower interest rates directly influences borrowing costs for businesses and consumer spending, affecting future profitability. Geopolitical Events: Global tensions or trade policies can introduce uncertainty, causing investors to become more cautious. Understanding these underlying drivers is crucial for anyone trying to make sense of daily market fluctuations in the US stock market. Navigating Volatility in the US Stock Market A mixed close, while not a dramatic downturn, serves as a reminder that market volatility is a constant companion for investors. For those involved in the US stock market, particularly individuals managing their portfolios, these days underscore the importance of a well-thought-out strategy. It’s important not to react impulsively to daily movements. Instead, consider these actionable insights: Diversification: Spreading investments across different sectors and asset classes can help mitigate risk when one area underperforms. Long-Term Perspective: Focusing on long-term financial goals rather than short-term gains can help weather daily market swings. Stay Informed: Keeping abreast of economic news and company fundamentals provides context for market behavior. Consult Experts: Financial advisors can offer personalized guidance based on individual risk tolerance and objectives. Even small movements in major indexes can signal shifts that require attention, guiding future investment decisions within the dynamic US stock market. What’s Next for the US Stock Market? Looking ahead, investors will be keenly watching for further economic indicators and corporate announcements to gauge the direction of the US stock market. Upcoming inflation data, statements from the Federal Reserve, and quarterly earnings reports will likely provide more clarity. The interplay of these factors will continue to shape investor confidence and, consequently, the performance of the Dow, S&P 500, and Nasdaq. Remaining informed and adaptive will be key to understanding the market’s trajectory. Conclusion: Wednesday’s mixed close in the US stock market highlights the intricate balance of forces influencing financial markets. While the Dow showed strength, the S&P 500 and Nasdaq experienced slight declines, reflecting a nuanced economic landscape. This reminds us that understanding the ‘why’ behind these movements is as important as the movements themselves. As always, a thoughtful, informed approach remains the best strategy for navigating the complexities of the market. Frequently Asked Questions (FAQs) Q1: What does a “mixed close” mean for the US stock market? A1: A mixed close indicates that while some major stock indexes advanced, others declined. It suggests that different sectors or types of companies within the US stock market are experiencing varying influences, rather than a uniform market movement. Q2: Which major indexes were affected on Wednesday? A2: On Wednesday, the Dow Jones Industrial Average gained 0.57%, while the S&P 500 edged down 0.1%, and the Nasdaq Composite slid 0.33%, illustrating the mixed performance across the US stock market. Q3: What factors contribute to a mixed stock market performance? A3: Mixed performances in the US stock market can be influenced by various factors, including specific corporate earnings, economic data releases, shifts in interest rate expectations, and broader geopolitical events that affect different market segments uniquely. Q4: How should investors react to mixed market signals? A4: Investors are generally advised to maintain a long-term perspective, diversify their portfolios, stay informed about economic news, and avoid impulsive decisions. Consulting a financial advisor can also provide personalized guidance for navigating the US stock market. Q5: What indicators should investors watch for future US stock market trends? A5: Key indicators to watch include upcoming inflation reports, statements from the Federal Reserve regarding monetary policy, and quarterly corporate earnings reports. These will offer insights into the future direction of the US stock market. Did you find this analysis of the US stock market helpful? Share this article with your network on social media to help others understand the nuances of current financial trends! To learn more about the latest stock market trends, explore our article on key developments shaping the US stock market‘s future performance. This post Crucial US Stock Market Update: What Wednesday’s Mixed Close Reveals first appeared on BitcoinWorld.
Share
Coinstats2025/09/18 05:30