XRP is facing pressure as price weakens while on-chain activity rises, creating a divergence that leaves traders watching key support levels closely. XRP is trading at $2.25, down 1.8% in the past 24 hours. Over the past week, it has…XRP is facing pressure as price weakens while on-chain activity rises, creating a divergence that leaves traders watching key support levels closely. XRP is trading at $2.25, down 1.8% in the past 24 hours. Over the past week, it has…

XRP price sees bearish divergence despite DEX volume surge

2025/11/05 14:39
3 min read
For feedback or concerns regarding this content, please contact us at crypto.news@mexc.com

XRP is facing pressure as price weakens while on-chain activity rises, creating a divergence that leaves traders watching key support levels closely.

Summary
  • XRP price falls even as trading and decentralized exchange activity rise, indicating caution
  • Rising volume with declining open interest suggests traders reducing exposure
  • Key support near $2.10, with ETF deadlines and possible Swell conference announcements shaping November outlook

XRP is trading at $2.25, down 1.8% in the past 24 hours. Over the past week, it has moved between $2.12 and $2.66, falling 13% for the period. In the last month, the decline has extended to 24%, and the token now sits about 38% below its $3.65 all-time high from July. 

Trading volume has risen to $9.85B in the past day, up 61.6%, which shows more active participation even as XRP (XRP) price pressure continues. Derivatives data provides a clearer view of sentiment. While open interest has decreased 9.93% to $3.43B, the overall volume of futures trading has increased 49.4% to $13.93B, as per CoinGlass data.

This combination often suggests that instead of entering new positions, traders are modifying or exiting existing ones.

Network activity rising while price weakens

According to a Nov. 5 analysis by CryptoQuant contributor CryptoOnchain, there has been a sharp rise in activity on XRP Ledger’s built-in decentralized exchange. The number of transactions reached 954,000 in a single day, which is the highest level seen in recent months. On paper, such a spike may appear supportive for the network, suggesting strong ecosystem engagement.

Yet the timing presents a concern. Earlier times of high network activity, like mid-July, coincided with price increases. The most recent spike in transactions occurred as XRP dropped from the $3 range to its current levels. The pattern suggests that the increase in activity may not be driven by accumulation.

It may instead stem from automated trading strategies, arbitrage behavior, or even distribution during a period of declining prices. Until price begins to move in step with network growth, this measure is better viewed as a warning sign rather than an immediate support factor.

Catalysts ahead may shape XRP price direction

The coming weeks include several events that could introduce volatility. Multiple spot XRP exchange-traded fund filings are approaching decision windows, including Canary Capital’s amended application that could auto-activate as early as Nov. 13. If approved, analysts estimate $1–$2B of potential inflows.

The ongoing Swell 2025 conference in New York, ending Nov. 5, may also bring announcements tied to payments, tokenized assets, and financial partnerships. At the same time, several institutional treasuries continue to hold large XRP positions, including firms preparing ETF products and public companies such as Evernorth and Virtu Financial.

XRP price technical analysis

Market structure remains weak. The relative strength index near 36 suggests continuous pressure rather than a stable base. The price is continuing its downward trend, trading below all major short- and mid-term moving averages, and the momentum and MACD are skewed negatively.

XRP price sees bearish divergence despite DEX volume surge - 1

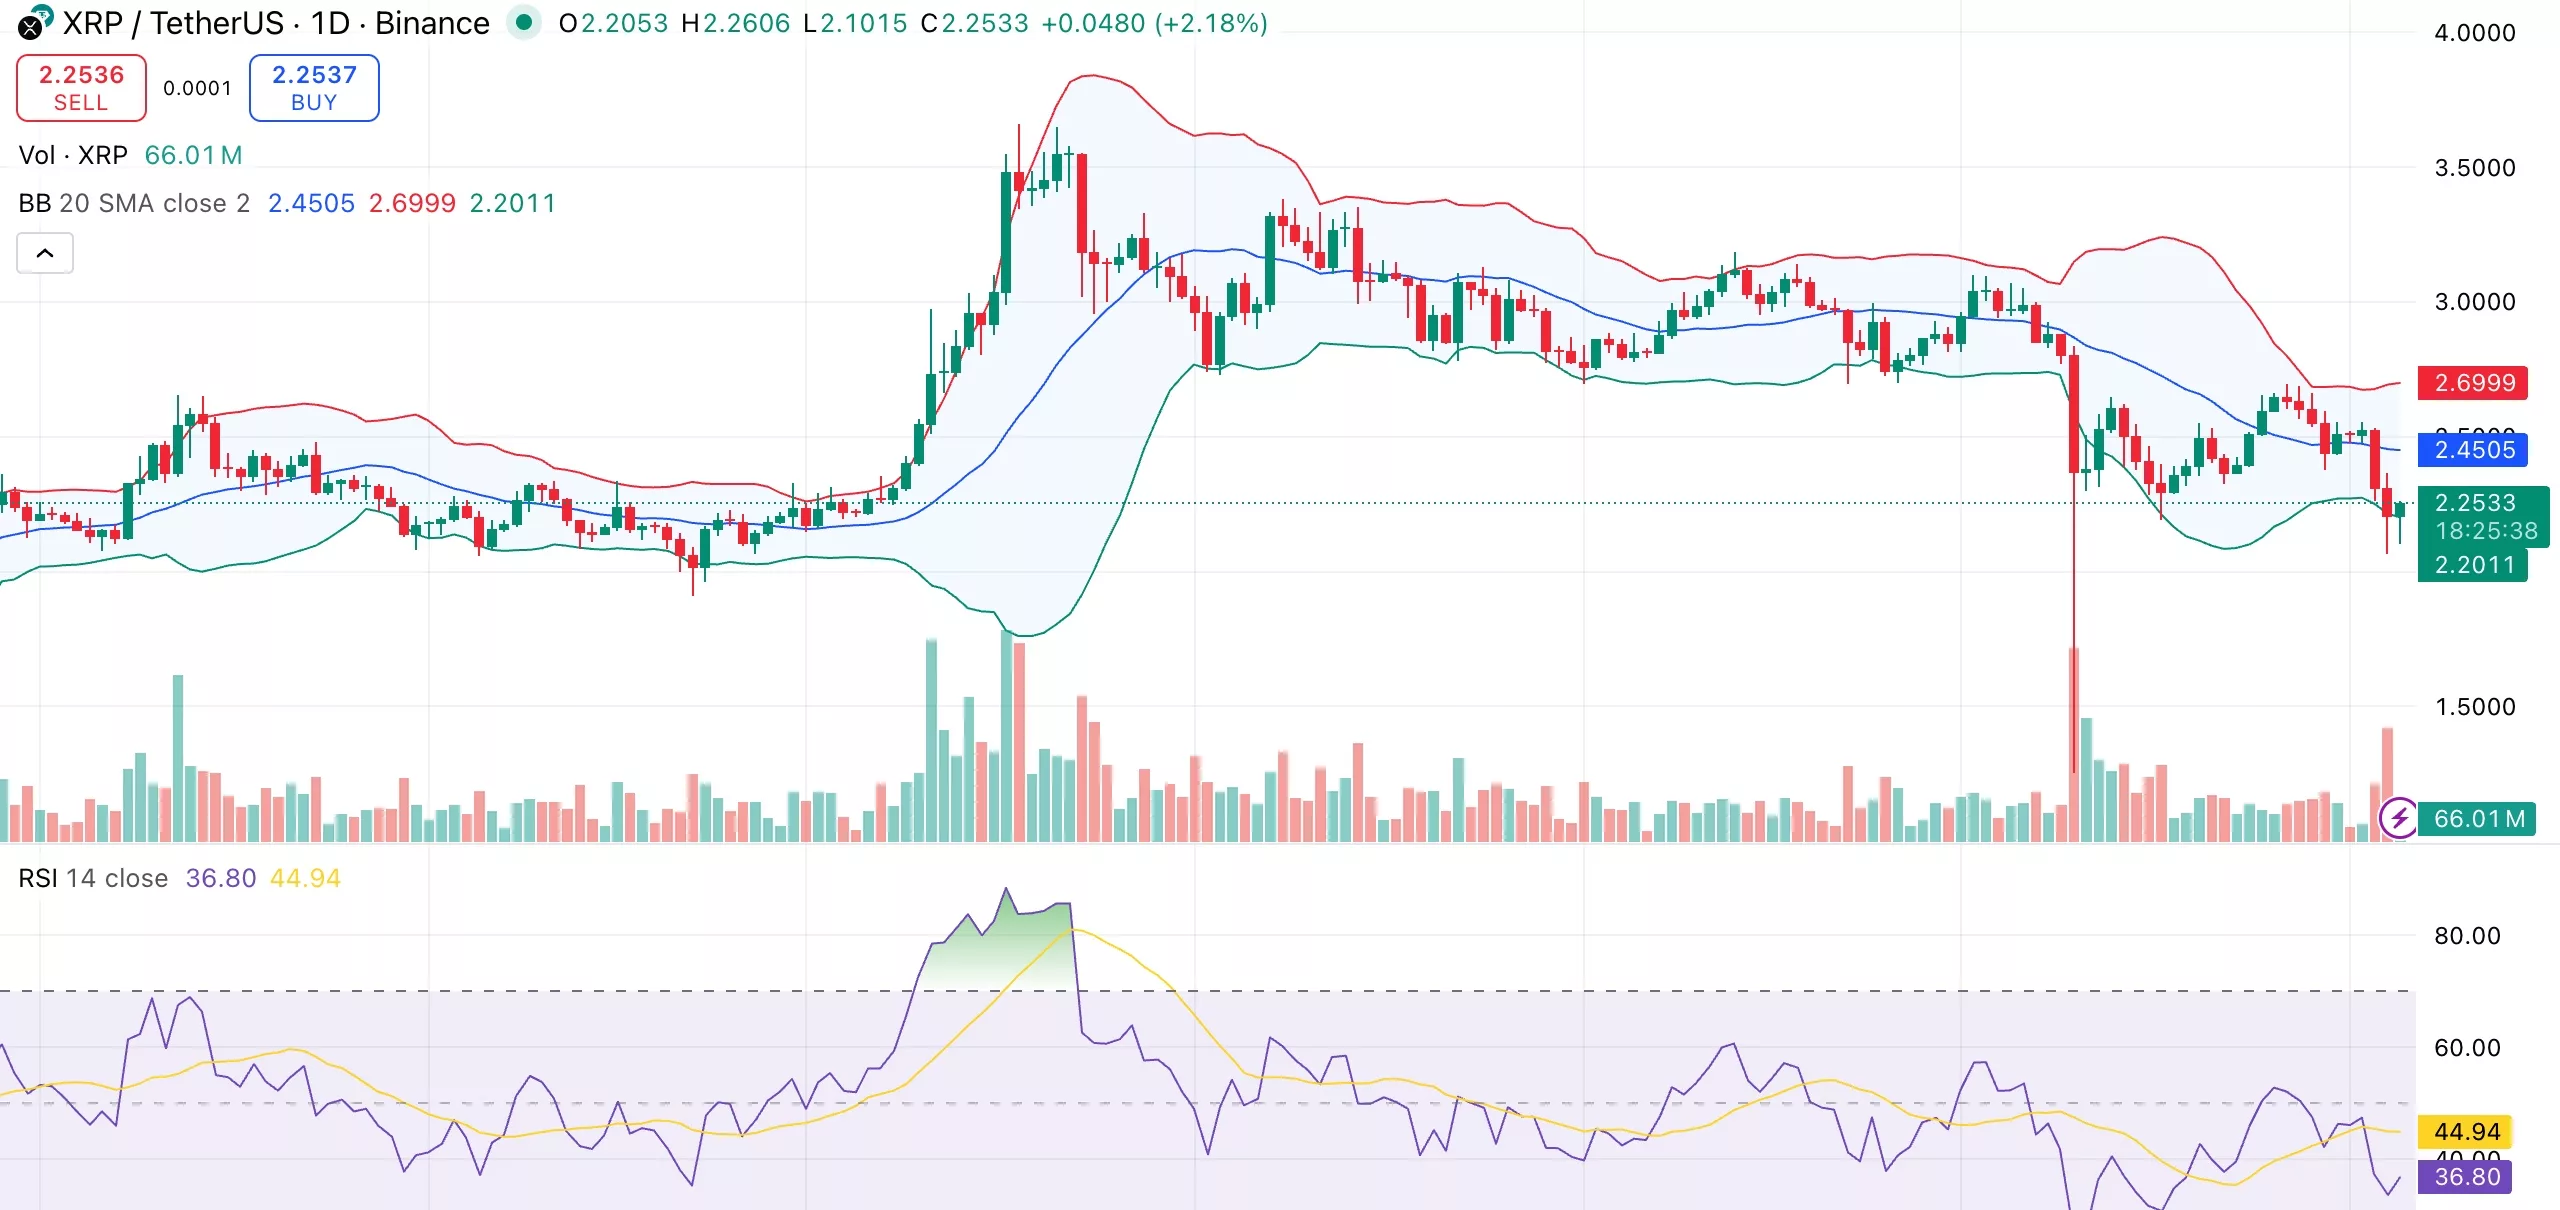
Any attempt at recovery would likely run into resistance in the $2.40–$2.50 range, where sellers have recently been active. Support is located near $2.10.

The market may find space for a controlled recovery propelled by catalysts if XRP maintains its $2.10 level. A clean break below that level would increase the risk of further retracement as positioning resets.

Market Opportunity
XRP Logo
XRP Price(XRP)
$1,0549
$1,0549$1,0549
-1,90%
USD
XRP (XRP) Live Price Chart
Disclaimer: The articles reposted on this site are sourced from public platforms and are provided for informational purposes only. They do not necessarily reflect the views of MEXC. All rights remain with the original authors. If you believe any content infringes on third-party rights, please contact crypto.news@mexc.com for removal. MEXC makes no guarantees regarding the accuracy, completeness, or timeliness of the content and is not responsible for any actions taken based on the information provided. The content does not constitute financial, legal, or other professional advice, nor should it be considered a recommendation or endorsement by MEXC.

You May Also Like

Ethereum koers toont zeldzaam dubbel koopsignaal en richt zich op $4.550

Ethereum koers toont zeldzaam dubbel koopsignaal en richt zich op $4.550

Connect met Like-minded Crypto Enthusiasts! Connect op Discord! Check onze Discord   Ethereum laat op de uurgrafiek twee opeenvolgende TD Sequential koopsignalen zien. Deze indicator meet uitputting in een trend en geeft vaak een signaal dat de verkoopdruk kan afnemen. Dit dubbele signaal verschijnt rond het niveau van $4.516, waar de ETH prijs kortstondig steun vindt. Dit type formatie komt zelden voor en wordt daarom extra nauwlettend gevolgd. Wat gaat de Ethereum koers hiermee doen? Ethereum koers test steun rond $4.516 De scherpe daling van de Ethereum koers vanaf de prijszone rond $4.800 bracht de ETH prijs in korte tijd naar ongeveer $4.516. Op dit niveau trad duidelijke koopactiviteit op, waardoor de neerwaartse beweging tijdelijk werd gestopt. Het dubbele signaal dat door de TD Sequential indicator is gegenereerd, viel precies samen met dit prijspunt. De TD Sequential is opgebouwd uit negen candles die een trend meetellen. Wanneer de negende candle verschijnt, kan dit duiden op een trendomslag. In dit geval verschenen zelfs twee signalen kort na elkaar, wat aangeeft dat de verkoopdruk mogelijk uitgeput is. Het feit dat dit gebeurde in een zone waar ETH kopers actief bleven, maakt het patroon extra opvallend. TD Sequential just flashed two buy signals for Ethereum $ETH! pic.twitter.com/JPO8EhiEPi — Ali (@ali_charts) September 16, 2025 Welke crypto nu kopen?Lees onze uitgebreide gids en leer welke crypto nu kopen verstandig kan zijn! Welke crypto nu kopen? Fed-voorzitter Jerome Powell heeft aangekondigd dat de rentes binnenkort zomaar eens omlaag zouden kunnen gaan, en tegelijkertijd blijft BlackRock volop crypto kopen, en dus lijkt de markt klaar om te gaan stijgen. Eén vraag komt telkens terug: welke crypto moet je nu kopen? In dit artikel bespreken we de munten die… Continue reading Ethereum koers toont zeldzaam dubbel koopsignaal en richt zich op $4.550 document.addEventListener('DOMContentLoaded', function() { var screenWidth = window.innerWidth; var excerpts = document.querySelectorAll('.lees-ook-description'); excerpts.forEach(function(description) { var excerpt = description.getAttribute('data-description'); var wordLimit = screenWidth wordLimit) { var trimmedDescription = excerpt.split(' ').slice(0, wordLimit).join(' ') + '...'; description.textContent = trimmedDescription; } }); }); Technische indicatoren schetsen herstelkans voor ETH Naast de dubbele koopsignalen verstrekken ook andere indicatoren belangrijke aanwijzingen. Tijdens de daling van de ETH koers waren grote rode candles zichtbaar, maar na de test van $4.516 stabiliseerde de Ethereum koers. Dit wijst op een mogelijke verschuiving in het evenwicht tussen de bears en bulls. Als deze opwaartse beweging doorzet, liggen de eerste weerstanden rond $4.550. Daarboven wacht een sterkere zone rond $4.650. Deze niveaus zijn in eerdere Ethereum sessies al meerdere keren getest. Een doorbraak zou ruimte openen richting de all-time high van ETH rond $4.953. Wanneer de prijs toch opnieuw onder $4.516 zakt, liggen er zones rond $4.500 en $4.450 waar grotere kooporders worden verwacht. Deze niveaus kunnen als een vangnet fungeren, mocht de druk opnieuw toenemen. Marktdynamiek bevestigt technische indicatoren De huidige situatie volgt op een bredere correctie in de cryptomarkt. Verschillende vooraanstaande crypto tokens zagen scherpe koersdalingen, waarna traders op zoek gingen naar signalen voor een mogelijke ommekeer. Dat juist Ethereum nu een dubbel TD Sequential signaal toont, versterkt de interesse in dit scenario. Fundamenteel blijft Ethereum sterk. Het aantal ETH tokens dat via staking is vastgezet, blijft groeien. Dat verkleint de vrije circulatie en vermindert verkoopdruk. Tegelijk blijft het netwerk intensief gebruikt voor DeFi, NFT’s en stablecoins. Deze activiteiten zorgen voor een stabiele vraag naar ETH, ook wanneer de prijs tijdelijk onder druk staat. Fundamentele drijfveren achter de Ethereum koers De Ethereum koers wordt echter niet alleen bepaald door candles en patronen, maar ook door bredere factoren. Een stijgend percentage van de totale ETH supply staat vast in staking contracten. Hierdoor neemt de liquiditeit op exchanges af. Dit kan prijsschommelingen versterken wanneer er plotseling meer koopdruk ontstaat. Daarnaast is Ethereum nog steeds het grootste smart contract platform. Nieuwe standaarden zoals ERC-8004 en ontwikkelingen rond layer-2 oplossingen houden de activiteit hoog. Deze technologische vooruitgang kan de waardepropositie ondersteunen en zo indirect bijdragen aan een ETH prijsherstel. Het belang van de korte termijn dynamiek De komende handelsdagen zullen duidelijk maken of de bulls genoeg kracht hebben om door de weerstandszone rond $4.550 te breken. Voor de bears ligt de focus juist op het verdedigen van de prijsregio rond $4.516. De whales, die met grote handelsorders opereren, kunnen hierin een beslissende rol spelen. Het dubbele TD Sequential signaal blijft hoe dan ook een zeldzame gebeurtenis. Voor cryptoanalisten vormt het een objectief aanknopingspunt om de kracht van de huidige Ethereum trend te toetsen. Vooruitblik op de ETH koers Ethereum liet twee opeenvolgende TD Sequential signalen zien op de uurgrafiek, iets wat zelden voorkomt. Deze formatie viel samen met steun rond $4.516, waar de bulls actief werden. Als de Ethereum koers boven dit niveau blijft, kan er ruimte ontstaan richting $4.550 en mogelijk $4.650. Zakt de prijs toch opnieuw onder $4.516, dan komen $4.500 en $4.450 in beeld als nieuwe steunzones. De combinatie van zeldzame indicatoren en een sterke fundamentele basis maakt Ethereum interessant voor zowel technische als fundamentele analyses. Of de bulls het momentum echt kunnen overnemen, zal blijken zodra de Ethereum koers de eerstvolgende weerstanden opnieuw test. Koop je crypto via Best Wallet Best wallet is een topklasse crypto wallet waarmee je anoniem crypto kan kopen. Met meer dan 60 chains gesupport kan je al je main crypto coins aanschaffen via Best Wallet. Best wallet - betrouwbare en anonieme wallet Best wallet - betrouwbare en anonieme wallet Meer dan 60 chains beschikbaar voor alle crypto Vroege toegang tot nieuwe projecten Hoge staking belongingen Lage transactiekosten Best wallet review Koop nu via Best Wallet Let op: cryptocurrency is een zeer volatiele en ongereguleerde investering. Doe je eigen onderzoek. Het bericht Ethereum koers toont zeldzaam dubbel koopsignaal en richt zich op $4.550 is geschreven door Dirk van Haaster en verscheen als eerst op Bitcoinmagazine.nl.
Share
Coinstats2025/09/17 23:31
Fed Day Dry Powder: Cryptoquant Analyst Tracks $7.6B Stablecoin Pile on Exchanges

Fed Day Dry Powder: Cryptoquant Analyst Tracks $7.6B Stablecoin Pile on Exchanges

The post Fed Day Dry Powder: Cryptoquant Analyst Tracks $7.6B Stablecoin Pile on Exchanges appeared on BitcoinEthereumNews.com. With the Federal Reserve meeting today, onchain flows are telegraphing that crypto traders are topping off exchanges and leaning long ahead of a widely expected 25-basis-point cut. Pre-Fed Positioning Stablecoins are doing the heavy lifting. Cryptoquant data shows $7.6 billion in fresh USDT and USDC (ERC-20) deposits heading to trading venues ahead of the decision. […] Source: https://news.bitcoin.com/fed-day-dry-powder-cryptoquant-analyst-tracks-7-6b-stablecoin-pile-on-exchanges/
Share
BitcoinEthereumNews2025/09/18 01:36
Michael Saylor’s Bitcoin Treasury Strategy Has Finally Hit Its Breaking Point

Michael Saylor’s Bitcoin Treasury Strategy Has Finally Hit Its Breaking Point

Bitcoin (CRYPTO:BTC) transformed from a niche digital asset into a mainstream investment over the past decade, and few people did more to accelerate that shift
Share
247 Wall St.2026/06/28 20:17

Newbies:Deposit $100, Get $1,000

Newbies:Deposit $100, Get $1,000Newbies:Deposit $100, Get $1,000

Plus Up to a $50 Referral Bonus