Bitcoin Coils Near Highs as Bulls Defend Gains Ahead of Resistance
Bitcoin price started a fresh increase above $92,500. BTC is now consolidating gains and might attempt an upside break above $93,500.
- Bitcoin started a fresh increase above the $92,500 zone.
- The price is trading above $92,000 and the 100 hourly Simple moving average.
- There was a break below a bullish trend line with support at $93,000 on the hourly chart of the BTC/USD pair (data feed from Kraken).
- The pair might continue to move up if it settles above the $93,000 zone.
Bitcoin Price Faces Resistance
Bitcoin price managed to stay above the $90,000 zone and started a fresh increase. BTC gained strength for a move above the $90,500 and $91,500 levels.
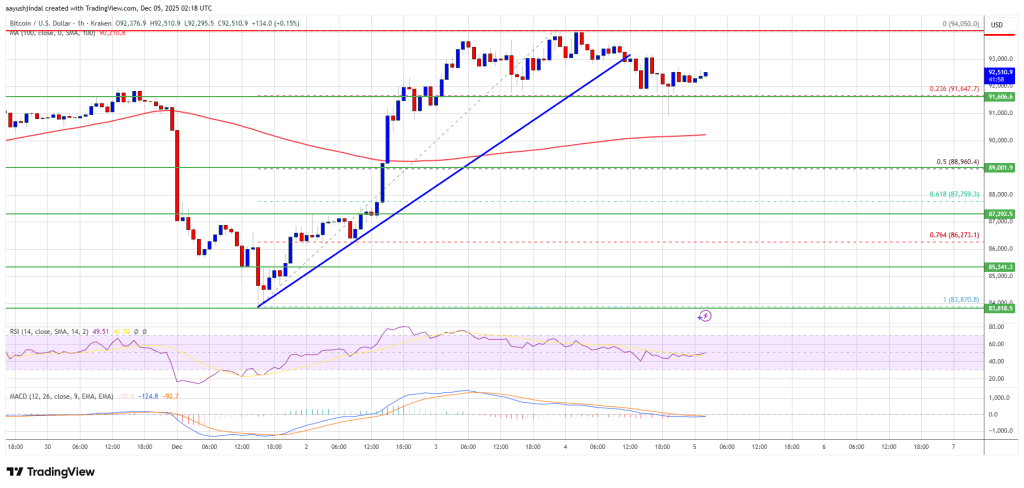
There was a clear move above the $93,000 resistance. A high was formed at $94,050 and the price is now consolidating gains. There was a minor drop to test the 23.6% Fib retracement level of the upward move from the $83,870 swing low to the $94,050 high.
There was a break below a bullish trend line with support at $93,000 on the hourly chart of the BTC/USD pair. Bitcoin is now trading above $92,000 and the 100 hourly Simple moving average.
If the bulls remain in action, the price could attempt another increase. Immediate resistance is near the $92,800 level. The first key resistance is near the $93,000 level. The next resistance could be $94,000. A close above the $94,000 resistance might send the price further higher. In the stated case, the price could rise and test the $95,000 resistance. Any more gains might send the price toward the $95,500 level. The next barrier for the bulls could be $96,200 and $96,450.
Downside Break In BTC?
If Bitcoin fails to rise above the $94,000 resistance zone, it could start another decline. Immediate support is near the $91,650 level. The first major support is near the $90,500 level.
The next support is now near the $88,950 zone or the 50% Fib retracement level of the upward move from the $83,870 swing low to the $94,050 high. Any more losses might send the price toward the $87,750 support in the near term. The main support sits at $87,200, below which BTC might accelerate lower in the near term.
Technical indicators:
Hourly MACD – The MACD is now losing pace in the bullish zone.
Hourly RSI (Relative Strength Index) – The RSI for BTC/USD is now below the 50 level.
Major Support Levels – $91,650, followed by $90,500.
Major Resistance Levels – $93,000 and $94,000.


You May Also Like

Order in the Court: Is it legal to arrest people drinking, smoking on streets?

US CENTCOM: Forces will start blockading Iranian ports on Monday, 10 AM ET.