Technical indicators indicate extreme underpricing, and Cardano ADA shows a SuperTrend buy signal. Weekly volume spikes with bullish divergence. The native token ADA of Cardano has caused a critical buy signal. According to crypto analyst Ali Charts, the SuperTrend indicator has switched to a bullish signal. ADA is at present trading at $0.4463, and it […] The post ADA Flashes BUY: SuperTrend Signals Major Breakout Ahead appeared first on Live Bitcoin News.Technical indicators indicate extreme underpricing, and Cardano ADA shows a SuperTrend buy signal. Weekly volume spikes with bullish divergence. The native token ADA of Cardano has caused a critical buy signal. According to crypto analyst Ali Charts, the SuperTrend indicator has switched to a bullish signal. ADA is at present trading at $0.4463, and it […] The post ADA Flashes BUY: SuperTrend Signals Major Breakout Ahead appeared first on Live Bitcoin News.

ADA Flashes BUY: SuperTrend Signals Major Breakout Ahead

2025/12/05 11:30

Technical indicators indicate extreme underpricing, and Cardano ADA shows a SuperTrend buy signal. Weekly volume spikes with bullish divergence.

The native token ADA of Cardano has caused a critical buy signal. According to crypto analyst Ali Charts, the SuperTrend indicator has switched to a bullish signal. ADA is at present trading at $0.4463, and it has gained 1.64 percent in the past 24 hours.

Its market capitalization is worth 16.02 billion. Trade volume has been as high as 694.47 million in the last day. Its fully diluted valuation is pegged at 20.08 billion.

Extreme Divergence Points to Explosive Move

The underestimation levels are unprecedented based on technical patterns. HM Research on X says that “Cardano is the most underpriced asset I have ever seen”. The analyst noted the formation of critical divergence on the weekly timeframes.

ADA Flashes BUY: SuperTrend Signals Major Breakout Ahead

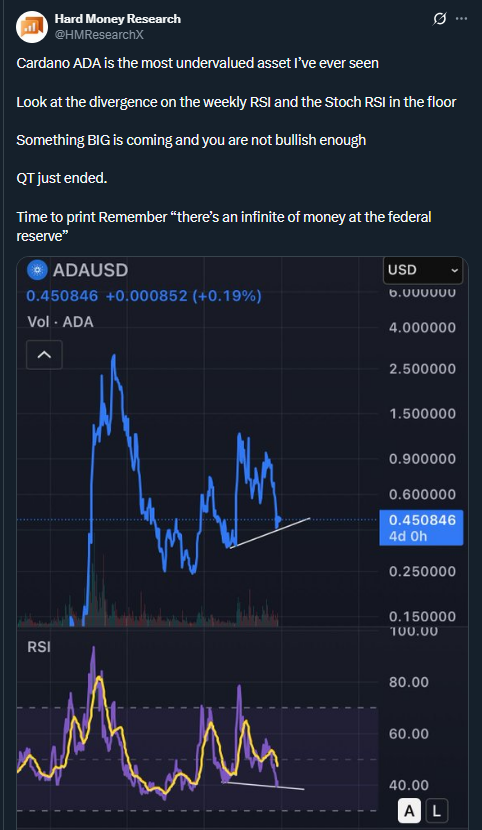
Source:  HM Research X 

Bullish divergence against price action in Weekly RSI. The Stochastic RSI is at floor levels at the moment. These two pointers are historically followed by significant price reversals.

HM Research tweeted: “Something BIG is coming, and you are not bullish enough. The analyst mentioned the termination of quantitative tightening. Cryptocurrency market liquidity can be stimulated by changes in federal monetary policy.

You might also like: Cardano News: Cardano Network Survives Crisis Without Going Down

SuperTrend Confirms Bullish Momentum Shift

The bullish thesis is confirmed by the SuperTrend technical indicator. Ali Charts registered the buy signal activation on X. SuperTrend is a combination of price action and volatility-based trailing stops.
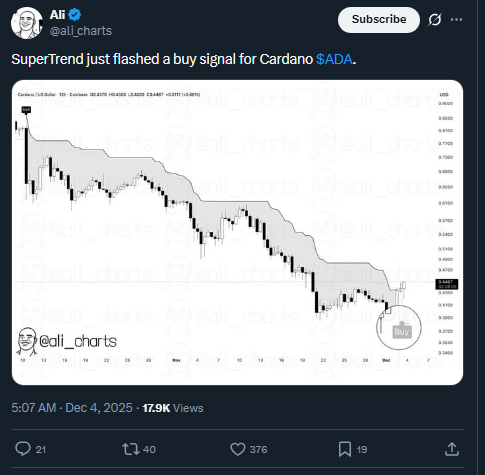
ADA Flashes BUY: SuperTrend Signals Major Breakout Ahead

Source:   Ali Charts

This indicator is good at detecting shifts in trends early. The buy signal is an indication that the trend has changed in favor of the bulls. SuperTrend is widely used by traders to enter an existing trend.

Volume trends hold the technical image even after negative growth. The 19.17% decline in 24-hour volume is still above the critical support levels. The accumulation in market structure indicates prevailing price levels.

The post ADA Flashes BUY: SuperTrend Signals Major Breakout Ahead appeared first on Live Bitcoin News.

Disclaimer: The articles reposted on this site are sourced from public platforms and are provided for informational purposes only. They do not necessarily reflect the views of MEXC. All rights remain with the original authors. If you believe any content infringes on third-party rights, please contact service@support.mexc.com for removal. MEXC makes no guarantees regarding the accuracy, completeness, or timeliness of the content and is not responsible for any actions taken based on the information provided. The content does not constitute financial, legal, or other professional advice, nor should it be considered a recommendation or endorsement by MEXC.

You May Also Like

QQQ short term cycle nearing end; pullback likely to attract buyers [Video]

QQQ short term cycle nearing end; pullback likely to attract buyers [Video]

The post QQQ short term cycle nearing end; pullback likely to attract buyers [Video] appeared on BitcoinEthereumNews.com. The short-term Elliott Wave outlook for the Nasdaq 100 ETF (QQQ) indicates that the cycle from the April 2025 low remains active. Wave (4) of the ongoing impulse concluded at 580.27, and the ETF has since resumed its upward trajectory. To confirm continuation, price must break above the prior wave (3) peak recorded on 30 October at 638.41. The rally from the 21 November wave (4) low has matured and is expected to complete soon, reflecting the natural rhythm of the Elliott Wave sequence. The advance from wave (4) has unfolded as a five-wave impulse. Within this structure, wave ((i)) ended at 586.25, followed by a corrective pullback in wave ((ii)) that terminated at 580.36. From there, the ETF nested higher. Wave (i) of the next sequence ended at 596.98, while wave (ii) pulled back to 589.44. Momentum carried wave (iii) to 606.76, before wave (iv) corrected to 597.32. The final leg, wave (v), reached 619.51, completing wave ((iii)) at a higher degree. A subsequent pullback in wave ((iv)) ended at 612.13. Looking ahead, wave ((v)) of 1 is expected to finish soon. Afterward, a corrective wave 2 should unfold, addressing the cycle from the 21 November low before the ETF resumes higher. In the near term, as long as the pivot at 580.27 remains intact, dips are anticipated to find support in a 3, 7, or 11 swing sequence, reinforcing prospects for further upside. Nasdaq 100 ETF (QQQ) 30-minute Elliott Wave chart from 12.5.2025 Nasdaq 100 ETF Elliott Wave [Video] Source: https://www.fxstreet.com/news/qqq-short-term-cycle-nearing-end-pullback-likely-to-attract-buyers-video-202512050323
Share
BitcoinEthereumNews2025/12/05 11:40