Hyperliquid Price Prediction: HYPE Slips 9% Amid Weak Retail Demand
Highlights:
- The Hyperliquid price drops 9% to $27, continuing the downtrend for the 6th day.
- Derivatives market shows a drop in open interest, suggesting a drop in retail demand.
- The technical outlook shows intense bearish sentiment and may test lower supports at $20.
Hyperliquid (HYPE) price is down by 9% to $27, continuing the downtrend on the 6th day. The bearish view is supported by the derivatives market data as traders risk-off due to heavy liquidations of long positions. The technical perspective is bearish, as the Hyperliquid price may continue the downtrend to $20.
Hyperliquid is losing the retail interest as the larger cryptocurrency market is drying up before the US Federal Reserve (Fed) may cut its rates on Wednesday. According to CoinGlass data, HYPE futures Open Interest (OI) is down by 6.63% in the past 24 hours at $1.45 billion. This means that HYPE derivatives have lost a lot of liquidity, with traders taking the wait-and-watch approach.
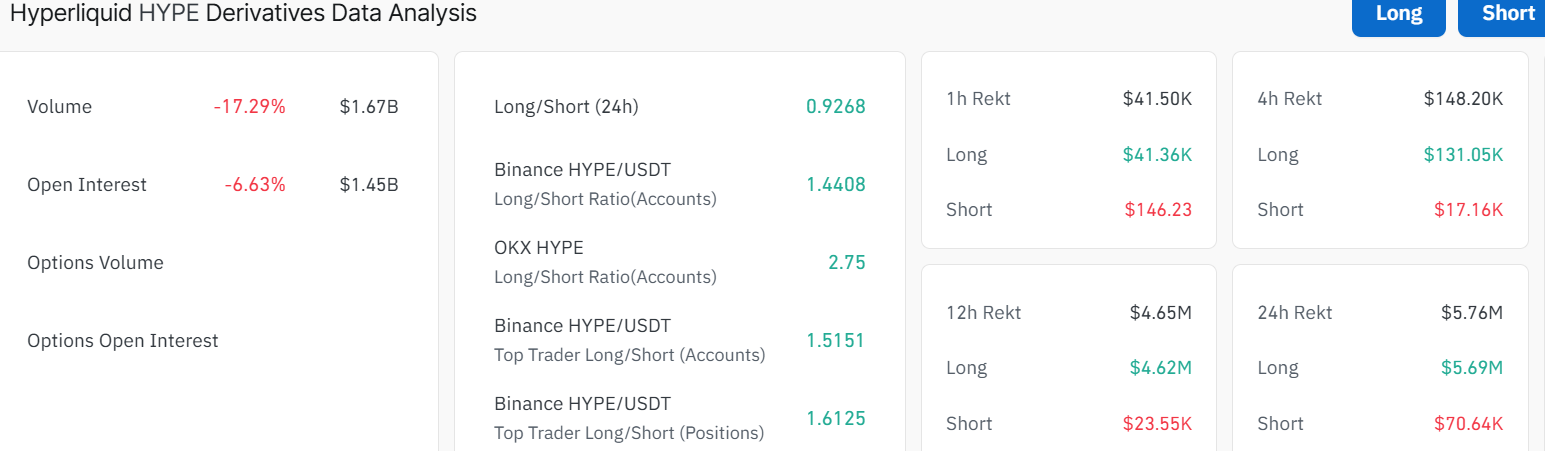 Hyperliquid Derivatives CoinGlass
The volume has notably dwindled 17% to $1.67 billion, indicating a decrease in market activity. The long-to-short ratio also sits below one at 0.9268, indicating intense bearishness in the HYPE market.
Hyperliquid Price Could Drop Further Towards $20
The daily HYPE/USD chart tells a cautious story. The coin broke out strongly in August, hitting a new ATH at $59. However, early profit-taking commenced, pushing the token into a downtrend, currently in a falling wedge. The 200-day SMA at $41 has flipped above the 50-day SMA at $37, indicating a death cross in the market. These moving averages are also acting as immediate resistance zones, cushioning the bulls against any further upside.
Currently, the price is on the verge of further downside, as the bears have taken control of the market. If the current price level cracks, further downside towards $25-$23 support zone may be imminent. On the other hand, if the crypto market flips positive, the token may rebound towards $35 soon.
 HYPE/USD 1-day chart: TradingView
Reinforcing the bearish outlook are the technical indicators. The RSI (Relative Strength Index) is at 32.87, with the yellow curve sitting at 40.55, showing that the Hyperliqid price is close to oversold levels. This hints at some buying potential if new catalysts emerge or institutional demand picks up. However, its position below the 50-mean level suggests intense selling pressure in the market.
Looking at the bigger picture, if the Hyperliquid price fails to hold above the near resistance at $35, it may test lower supports, with $20 as a last line for buyers. In the meantime, the immediate support zone at $25-$23 are key level to watch in case bears strengthen momentum.
On the other hand, if the HYPE token can hold above $35 and attract more big buyers, a rebound towards $37 resistance is possible. A break above the $37 mark will indicate renewed strength in the market, pushing the Hyperliquid price further towards $39-$41. But if selling continues and support fails, a deeper drop toward $20 could tempt long-term accumulators looking for cheap entries.
eToro Platform
Best Crypto Exchange
- Over 90 top cryptos to trade
- Regulated by top-tier entities
- User-friendly trading app
- 30+ million users
eToro is a multi-asset investment platform. The value of your investments may go up or down. Your capital is at risk. Don’t invest unless you’re prepared to lose all the money you invest. This is a high-risk investment, and you should not expect to be protected if something goes wrong.


You May Also Like

Satoshi-Era Whale Challenges Michael Saylor With Sudden Bitcoin Move, XRP Hits Record 2026 Bollinger Bands Squeeze, Binance Delists Batch of BTC and ETH Pairs: Morning Crypto Report

Wildcoins Review – Get UPTO 3.5 BTC for Free