Bitcoin price started a decent increase above $92,000. BTC is now consolidating gains and might aim for another increase if it clears $93,400. Bitcoin started a downside correction from the $94,500 zone. The price is trading above $92,000 and the 100 hourly Simple moving average. There is a bullish trend line forming with support at $91,500 on the hourly chart of the BTC/USD pair (data feed from Kraken). The pair might continue to move up if it settles above the $93,400 zone. Bitcoin Price Holds Support Bitcoin price managed to stay above the $91,000 zone and started a fresh increase. BTC gained strength for a move above the $92,500 and $94,000 levels. However, the bears were active near $94,500. A high was formed at $94,583 and the price recently corrected some gains. There was a drop toward the 50% Fib retracement level of the upward move from the $89,545 swing low to the $94,583 high. However, the bulls were active near the $92,000 support. Bitcoin is now trading below $92,000 and the 100 hourly Simple moving average. Besides, there is a bullish trend line forming with support at $91,500 on the hourly chart of the BTC/USD pair. If the bulls remain in action, the price could attempt another increase. Immediate resistance is near the $92,800 level. The first key resistance is near the $93,200 level. The next resistance could be $94,000. A close above the $94,000 resistance might send the price further higher. In the stated case, the price could rise and test the $94,500 resistance. Any more gains might send the price toward the $95,500 level. The next barrier for the bulls could be $96,200 and $96,500. More Losses In BTC? If Bitcoin fails to rise above the $94,000 resistance zone, it could start another decline. Immediate support is near the $92,000 level. The first major support is near the $91,500 level and the 61.8% Fib retracement level of the upward move from the $89,545 swing low to the $94,583 high. The next support is now near the $90,750 zone. Any more losses might send the price toward the $90,000 support in the near term. The main support sits at $88,800, below which BTC might accelerate lower in the near term. Technical indicators: Hourly MACD – The MACD is now gaining pace in the bullish zone. Hourly RSI (Relative Strength Index) – The RSI for BTC/USD is now above the 50 level. Major Support Levels – $92,000, followed by $91,500. Major Resistance Levels – $93,200 and $94,000.Bitcoin price started a decent increase above $92,000. BTC is now consolidating gains and might aim for another increase if it clears $93,400. Bitcoin started a downside correction from the $94,500 zone. The price is trading above $92,000 and the 100 hourly Simple moving average. There is a bullish trend line forming with support at $91,500 on the hourly chart of the BTC/USD pair (data feed from Kraken). The pair might continue to move up if it settles above the $93,400 zone. Bitcoin Price Holds Support Bitcoin price managed to stay above the $91,000 zone and started a fresh increase. BTC gained strength for a move above the $92,500 and $94,000 levels. However, the bears were active near $94,500. A high was formed at $94,583 and the price recently corrected some gains. There was a drop toward the 50% Fib retracement level of the upward move from the $89,545 swing low to the $94,583 high. However, the bulls were active near the $92,000 support. Bitcoin is now trading below $92,000 and the 100 hourly Simple moving average. Besides, there is a bullish trend line forming with support at $91,500 on the hourly chart of the BTC/USD pair. If the bulls remain in action, the price could attempt another increase. Immediate resistance is near the $92,800 level. The first key resistance is near the $93,200 level. The next resistance could be $94,000. A close above the $94,000 resistance might send the price further higher. In the stated case, the price could rise and test the $94,500 resistance. Any more gains might send the price toward the $95,500 level. The next barrier for the bulls could be $96,200 and $96,500. More Losses In BTC? If Bitcoin fails to rise above the $94,000 resistance zone, it could start another decline. Immediate support is near the $92,000 level. The first major support is near the $91,500 level and the 61.8% Fib retracement level of the upward move from the $89,545 swing low to the $94,583 high. The next support is now near the $90,750 zone. Any more losses might send the price toward the $90,000 support in the near term. The main support sits at $88,800, below which BTC might accelerate lower in the near term. Technical indicators: Hourly MACD – The MACD is now gaining pace in the bullish zone. Hourly RSI (Relative Strength Index) – The RSI for BTC/USD is now above the 50 level. Major Support Levels – $92,000, followed by $91,500. Major Resistance Levels – $93,200 and $94,000.

Bitcoin Price Shows Fresh Strength—Could This Spark a Rapid Rally?

2025/12/10 10:29
3 min read
For feedback or concerns regarding this content, please contact us at crypto.news@mexc.com

Bitcoin price started a decent increase above $92,000. BTC is now consolidating gains and might aim for another increase if it clears $93,400.

  • Bitcoin started a downside correction from the $94,500 zone.
  • The price is trading above $92,000 and the 100 hourly Simple moving average.
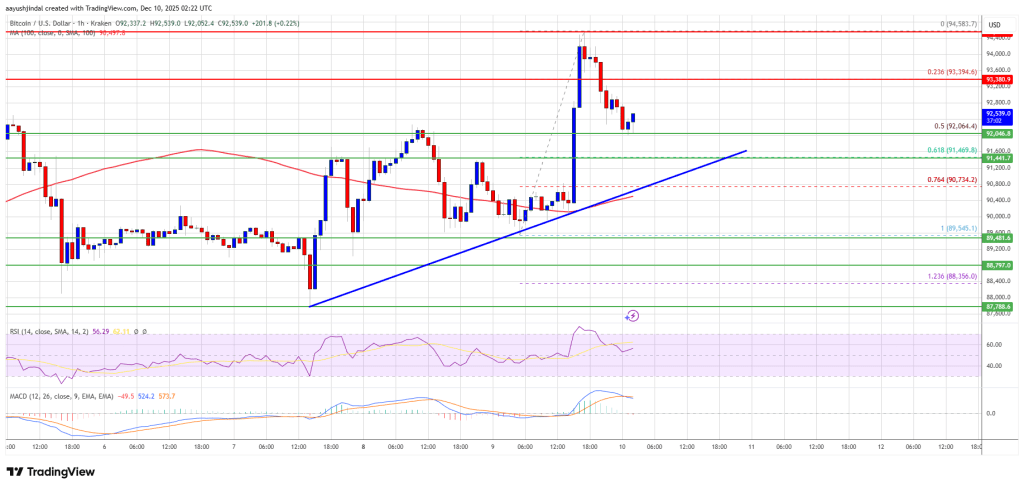
  • There is a bullish trend line forming with support at $91,500 on the hourly chart of the BTC/USD pair (data feed from Kraken).
  • The pair might continue to move up if it settles above the $93,400 zone.

Bitcoin Price Holds Support

Bitcoin price managed to stay above the $91,000 zone and started a fresh increase. BTC gained strength for a move above the $92,500 and $94,000 levels.

However, the bears were active near $94,500. A high was formed at $94,583 and the price recently corrected some gains. There was a drop toward the 50% Fib retracement level of the upward move from the $89,545 swing low to the $94,583 high.

However, the bulls were active near the $92,000 support. Bitcoin is now trading below $92,000 and the 100 hourly Simple moving average. Besides, there is a bullish trend line forming with support at $91,500 on the hourly chart of the BTC/USD pair.
Bitcoin Price

If the bulls remain in action, the price could attempt another increase. Immediate resistance is near the $92,800 level. The first key resistance is near the $93,200 level. The next resistance could be $94,000. A close above the $94,000 resistance might send the price further higher. In the stated case, the price could rise and test the $94,500 resistance. Any more gains might send the price toward the $95,500 level. The next barrier for the bulls could be $96,200 and $96,500.

More Losses In BTC?

If Bitcoin fails to rise above the $94,000 resistance zone, it could start another decline. Immediate support is near the $92,000 level. The first major support is near the $91,500 level and the 61.8% Fib retracement level of the upward move from the $89,545 swing low to the $94,583 high.

The next support is now near the $90,750 zone. Any more losses might send the price toward the $90,000 support in the near term. The main support sits at $88,800, below which BTC might accelerate lower in the near term.

Technical indicators:

Hourly MACD – The MACD is now gaining pace in the bullish zone.

Hourly RSI (Relative Strength Index) – The RSI for BTC/USD is now above the 50 level.

Major Support Levels – $92,000, followed by $91,500.

Major Resistance Levels – $93,200 and $94,000.

Market Opportunity
Bitcoin Logo
Bitcoin Price(BTC)
$63 969,15
$63 969,15$63 969,15
+0,80%
USD
Bitcoin (BTC) Live Price Chart

World Cup Combo: Aim for 200x

World Cup Combo: Aim for 200xWorld Cup Combo: Aim for 200x

Combine up to 20 World Cup matches in one order

Disclaimer: The articles reposted on this site are sourced from public platforms and are provided for informational purposes only. They do not necessarily reflect the views of MEXC. All rights remain with the original authors. If you believe any content infringes on third-party rights, please contact crypto.news@mexc.com for removal. MEXC makes no guarantees regarding the accuracy, completeness, or timeliness of the content and is not responsible for any actions taken based on the information provided. The content does not constitute financial, legal, or other professional advice, nor should it be considered a recommendation or endorsement by MEXC.

You May Also Like

Cathie Wood’s ARK Invest Buys $13.7M in Circle Shares While Selling Robinhood Stock

Cathie Wood’s ARK Invest Buys $13.7M in Circle Shares While Selling Robinhood Stock

TLDR ARK Invest bought 217,896 Circle Internet Group shares for ~$13.7M on July 9 ARK sold 85,319 Robinhood Markets shares worth ~$9.8M on the same day ARK has
Share
Coincentral2026/07/10 14:51
The changing face of elder care in Malaysia — Sayed Mohammad Reza Yamani Sayed Umar

The changing face of elder care in Malaysia — Sayed Mohammad Reza Yamani Sayed Umar

JULY 10 — An elderly society is becoming increasingly prevalent in Malaysia at present. It is projected that the p...
Share
Malaymail2026/07/10 15:24
One Of Frank Sinatra’s Most Famous Albums Is Back In The Spotlight

One Of Frank Sinatra’s Most Famous Albums Is Back In The Spotlight

The post One Of Frank Sinatra’s Most Famous Albums Is Back In The Spotlight appeared on BitcoinEthereumNews.com. Frank Sinatra’s The World We Knew returns to the Jazz Albums and Traditional Jazz Albums charts, showing continued demand for his timeless music. Frank Sinatra performs on his TV special Frank Sinatra: A Man and his Music Bettmann Archive These days on the Billboard charts, Frank Sinatra’s music can always be found on the jazz-specific rankings. While the art he created when he was still working was pop at the time, and later classified as traditional pop, there is no such list for the latter format in America, and so his throwback projects and cuts appear on jazz lists instead. It’s on those charts where Sinatra rebounds this week, and one of his popular projects returns not to one, but two tallies at the same time, helping him increase the total amount of real estate he owns at the moment. Frank Sinatra’s The World We Knew Returns Sinatra’s The World We Knew is a top performer again, if only on the jazz lists. That set rebounds to No. 15 on the Traditional Jazz Albums chart and comes in at No. 20 on the all-encompassing Jazz Albums ranking after not appearing on either roster just last frame. The World We Knew’s All-Time Highs The World We Knew returns close to its all-time peak on both of those rosters. Sinatra’s classic has peaked at No. 11 on the Traditional Jazz Albums chart, just missing out on becoming another top 10 for the crooner. The set climbed all the way to No. 15 on the Jazz Albums tally and has now spent just under two months on the rosters. Frank Sinatra’s Album With Classic Hits Sinatra released The World We Knew in the summer of 1967. The title track, which on the album is actually known as “The World We Knew (Over and…
Share
BitcoinEthereumNews2025/09/18 00:02

Activate to Enjoy Special Perks

Activate to Enjoy Special PerksActivate to Enjoy Special Perks

Access 0 fees, premium support, and loss coverage.