Bitcoin Price Drops 2.5% Despite Federal Reserve’s 25bp Interest Rate Cut
The Bitcoin price tumbled 2.5% in the past 24 hours to trade at $90,185 as of 2:32 a.m. EST on trading volume that rose 9% to $58.3 billion.
This comes despite the US Federal Reserve announcing its third benchmark interest rate cut this year. It sliced 25 basis points (0.25%) off its federal funds rate as Fed Chair Jay Powell forecast one more cut in 2026.
After the announcement, Bitcoin attempted a short-term rebound to around $94,000, but was pushed back. Prices later recovered somewhat, but volatility widened, and the $90,000 level did not hold.
Fed Chair Jerome Powell reaffirmed the Fed’s price stability goal but maintained a cautious stance on further easing. The market reacted positively to the rate cut itself, but it was not enough to trigger a strong rotation into risk assets.
Bitcoin Price On A Consolidation Phase, Poised For A Breakout
After plunging slightly to the $75,000 support level in April, the BTC price recovered to an all-time high (ATH) of around $126,230, according to the TradingView 3-day chart.
This dramatic surge allowed sellers to book profits, pushing the Bitcoin price back into a falling channel pattern and overcoming key support levels on the Fibonacci Retracement chart.
With the drop, the price of BTC crossed below both the 50-day and 200-day Simple Moving Averages (SMAs), further cementing the overall bearish stance.
However, support around $82,000 allowed the Bitcoin price to stage a recovery attempt. Still, it has since been capped below the $94,000 resistance, leaving BTC to hover in a sideways pattern between the 0.786 and 0.618 Fib levels, $85,574 and $94,260, respectively.
BTC is currently trading at the upper boundary of the falling channel pattern, attempting a breakout above it, as the price has recently crossed above the 200-day SMA ($88,843).
Meanwhile, the Relative Strength Index (RSI) seems to be consolidating within the $34 zone, currently at 35, which suggests a recovery, but buyers are still encountering some resistance.
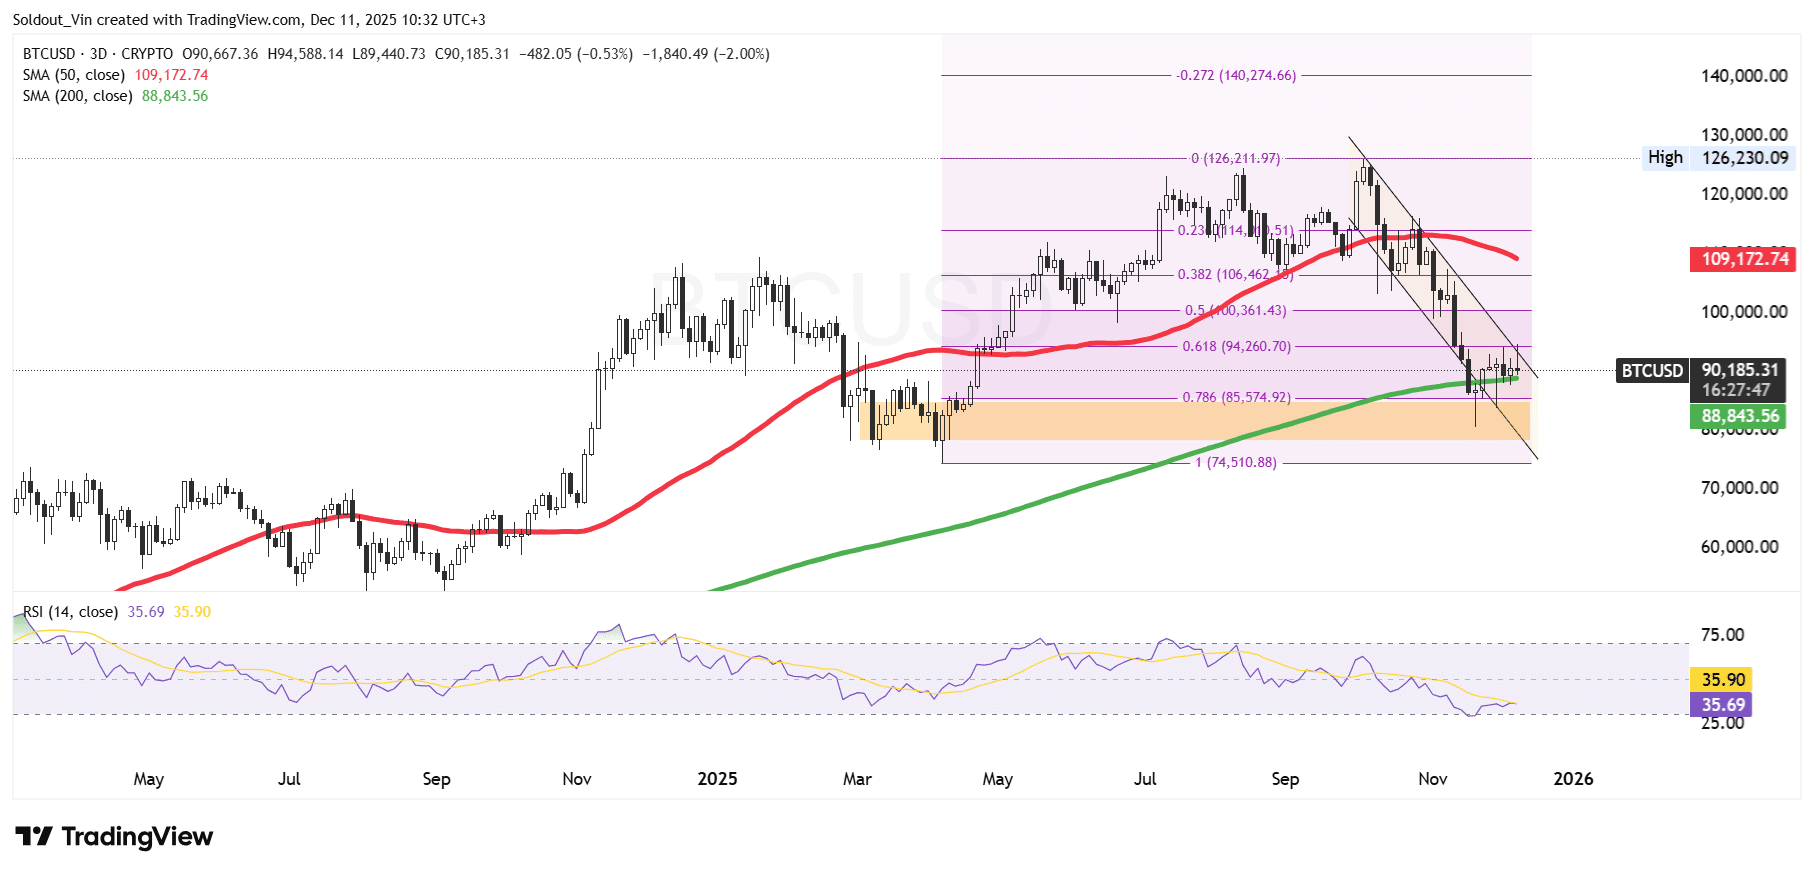 BTC/USD Chart Analysis Source: TradingView
BTC Price Prediction
Based on the current chart structure, the BTC price appears to be stabilising near the confluence of the 200-day SMA and the 0.786 -0.618 Fibonacci retracement zone, which often acts as a final support region during deeper corrections.
If the Bitcoin price holds above this area and breaks out of the falling channel pattern, a relief rally toward the mid-Fibonacci levels, around $94,000–$100,000, becomes probable. A stronger breakout could then target the 0.382 and 0.236 retracements near $106,000–$114,000.
However, if BTC loses the 200-day SMA and closes below the highlighted support box, momentum could shift toward a retest of the deeper Fibonacci extension around $74,500, which represents the full retracement from the prior swing.
Michaël van de Poppe, the founder of MN Fund and a popular market analyst with over 815k followers on X, says that if BTC holds around the $91,800 level, the next key resistance will be the $100,000 zone.
Overall, the price of BTC is at a critical juncture, with the future price direction hinging on whether this support cluster holds.
Related News:


You May Also Like

Cathie Wood’s ARK Invest Buys $13.7M in Circle Shares While Selling Robinhood Stock

Metaplanet buys 5,075 Bitcoin in Q1 to become 3rd-largest treasury

The changing face of elder care in Malaysia — Sayed Mohammad Reza Yamani Sayed Umar