Crypto markets are stabilizing after the Federal Reserve’s latest rate cut, with traders reassessing how a more data-dependent policy path may influence liquidityCrypto markets are stabilizing after the Federal Reserve’s latest rate cut, with traders reassessing how a more data-dependent policy path may influence liquidity

BTC Recalibrates After Fed Cut as AI Correlation Deepens, Says Nansen

2025/12/12 05:13
3 min read

Crypto markets are stabilizing after the Federal Reserve’s latest rate cut, with traders reassessing how a more data-dependent policy path may influence liquidity conditions heading into early 2026.

According to a new note from on-chain analytics firm Nansen, the combination of revised forward guidance, fresh liquidity tools, and shifting cross-asset dynamics has created a more complex environment for digital assets.

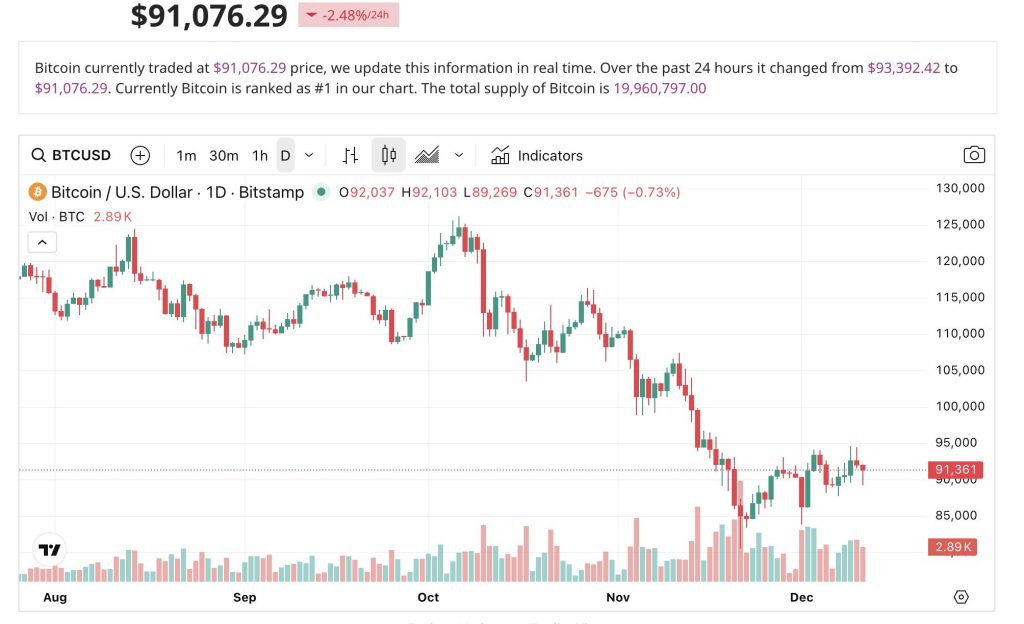
Earlier today, Bitcoin briefly rallied above $92,000 before retreating, mirroring broader volatility across risk markets following the Federal Open Market Committee (FOMC) meeting.

Aurelie Barthere, Principal Research Analyst at Nansen, said markets were braced for a rate cut paired with hawkish messaging but instead received a cut accompanied by “uncertain, data-dependent” guidance. The Fed’s introduction of T-bill purchases and removal of the cap on the standing repo facility added to the perception of a potential liquidity boost in the first quarter of 2026.

AI Stocks Drive BTC’s Latest Pullback

Bitcoin’s post-FOMC dip occurred alongside sharp moves in large U.S. AI names following Oracle’s earnings release. Barthere notes that while the AI sector continues to post strong earnings and capex growth, valuations have climbed to levels that are increasingly difficult to justify as 2026 approaches.

She added that BTC has shown rising correlation with AI-themed equities—a relationship she expects to persist. “I expect that relationship to continue until we see a more meaningful sell-off that fully ‘cleans’ valuations in the sector,” she said. As long as AI stocks react sharply to earnings surprises or guidance revisions, BTC is likely to echo those swings.

Key Resistance at $91K as Positioning Stays Stretched

From a technical and market-structure perspective, Barthere emphasized $91,000 as the dominant resistance level for BTC. Sustained trading above that mark for several weeks would be needed to confirm a renewed uptrend.

However, the derivatives markets are showing stretched positioning with open interest in both futures and options at record highs. Elevated leverage increases the risk of abrupt moves if sentiment shifts or liquidity thins.

Heading into year-end, traders are holding considerable downside protection. Options imply a 48% probability that BTC reclaims $91,000, and futures funding rates remain only mildly positive, suggesting leveraged longs are not aggressively dominating.

2026 Outlook: Bullish Options, Risk of Disappointment

Looking further ahead, Nansen notes that options markets are structurally bullish for 2026, reflecting expectations for improved liquidity, macro stability, and continued institutional inflows.

However, Barthere cautioned that such positioning could prove vulnerable if economic data or earnings trends fail to meet optimistic assumptions. With markets recalibrating, traders will be watching how liquidity dynamics evolve and whether BTC can break cleanly above resistance to regain upward momentum.

In September, Nansen announced the launch of Nansen AI, a mobile agent designed to transform how investors and traders interact with blockchain data.

Market Opportunity
Bitcoin Logo
Bitcoin Price(BTC)
$69,035.08
$69,035.08$69,035.08
+0.59%
USD
Bitcoin (BTC) Live Price Chart
Disclaimer: The articles reposted on this site are sourced from public platforms and are provided for informational purposes only. They do not necessarily reflect the views of MEXC. All rights remain with the original authors. If you believe any content infringes on third-party rights, please contact service@support.mexc.com for removal. MEXC makes no guarantees regarding the accuracy, completeness, or timeliness of the content and is not responsible for any actions taken based on the information provided. The content does not constitute financial, legal, or other professional advice, nor should it be considered a recommendation or endorsement by MEXC.

You May Also Like

Pi Network Targets Open Mainnet 2026, Millions Prepare as Utility and Migration Accelerate

Pi Network Targets Open Mainnet 2026, Millions Prepare as Utility and Migration Accelerate

The Pi Network community is once again buzzing with renewed optimism following a powerful message circulating on social media regarding the project’s roadmap t
Share
Hokanews2026/02/07 20:41
Bitcoin Rainbow chart predicts BTC price for October 1, 2025

Bitcoin Rainbow chart predicts BTC price for October 1, 2025

The post Bitcoin Rainbow chart predicts BTC price for October 1, 2025 appeared on BitcoinEthereumNews.com. The Bitcoin (BTC) Rainbow Chart has outlined potential price ranges for October 1, 2025, as the asset seeks to reclaim the $120,000 resistance. Throughout September, the maiden cryptocurrency has struggled to push past the $115,000 support zone. At press time, Bitcoin was trading at $115,950, up 0.15% in the past 24 hours and gaining a modest 0.5% over the past week. Bitcoin seven-day price chart. Source: Finbold Looking ahead to October 1, the Rainbow Chart projects that Bitcoin’s price could fall within a broad band of $36,628 to $409,726, depending on prevailing market sentiment. The Rainbow Chart, a long-term valuation model often used to track Bitcoin’s price cycles, is built as a logarithmic regression chart. It color-codes Bitcoin’s valuation bands, offering investors a simplified way to gauge whether the market is undervalued or overheated. Bitcoin price prediction  The lowest tier, labeled “Basically a Fire Sale,” spans from $36,628 to $47,947. Above that, the “BUY!” zone ranges from $47,947 to $64,777, while “Accumulate” covers $64,777 to $83,811. The “Still Cheap” band sets Bitcoin between $83,811 and $108,471, followed by the neutral “HODL!” zone at $108,471 to $142,332. Bitcoin Rainbow chart. Source: BlockhainCenter Cautionary levels emerge as prices climb higher. In this case, the “Is this a bubble?” range extends from $142,332 to $181,644, while “FOMO intensifies” lies between $181,644 and $233,215. On the other hand, the red zones, seen as overheated territory, start with “Sell. Seriously, SELL!” at $233,215 to $304,169 and peak with “Maximum Bubble Territory” from $304,169 to $409,726. With Bitcoin trading around $116,000 as of September 20, the Rainbow Chart suggests that by October 1, 2025, the asset will most likely fall within the “Still Cheap” or “HODL!” bands, implying a fair value between $83,811 and $142,332. This outlook indicates that despite Bitcoin’s strong gains, the model places…
Share
BitcoinEthereumNews2025/09/21 01:51
White House Schedules Tuesday Stablecoin Talks as Banks Enter the Room

White House Schedules Tuesday Stablecoin Talks as Banks Enter the Room

The White House will host crypto firms and banks on February 10 to continue talks on stablecoin rules and advance the crypto market bill. The White House has set
Share
LiveBitcoinNews2026/02/07 19:45