Shiba Inu (SHIB) token was trading at $0.00000841 today, Dec. 12, a few points above the year-to-date low of $0.00000753.Shiba Inu (SHIB) token was trading at $0.00000841 today, Dec. 12, a few points above the year-to-date low of $0.00000753.

Shiba Inu Coin rebound looms as whales suddenly buy amid reserves drain

2025/12/13 00:12

Shiba Inu Coin price has been in a freefall this year as demand for meme coins waned. This rebound could be about to end as key fundamentals and technicals align.

Summary
  • Shiba Inu Coin price has dropped and is now in a technical bear market.
  • Whales have started buying SHIB as the supply in exchanges has tumbled.
  • Technical analysis suggests that the token has more upside in the near term.

Shiba Inu (SHIB) token was trading at $0.00000841 today, Dec. 12, a few points above the year-to-date low of $0.00000753. It remains ~75% below its highest point in November last year.

Shiba Inu Coin fundamentals are improving 

Shiba Inu token has dropped this year as demand for meme coins has waned, with the market capitalization of all these tokens falling to $46 billion from the year-to-date high of nearly $100 billion.

There are signs that Shiba Inu’s fundamentals are improving, which might lead to more upside in the near term.

One fundamental is that token burn has rebounded in recent days. The daily rate rose by 170% on Friday, bringing the total token burns since inception to over 410.75 billion.

Additional data indicate that the supply of SHIB tokens on exchanges has declined sharply. Its supply dropped to 288.75 trillion today, down from this month’s high of 366.1 trillion. A decline in exchange supply indicates increased demand for the token.

SHB exchange supplies

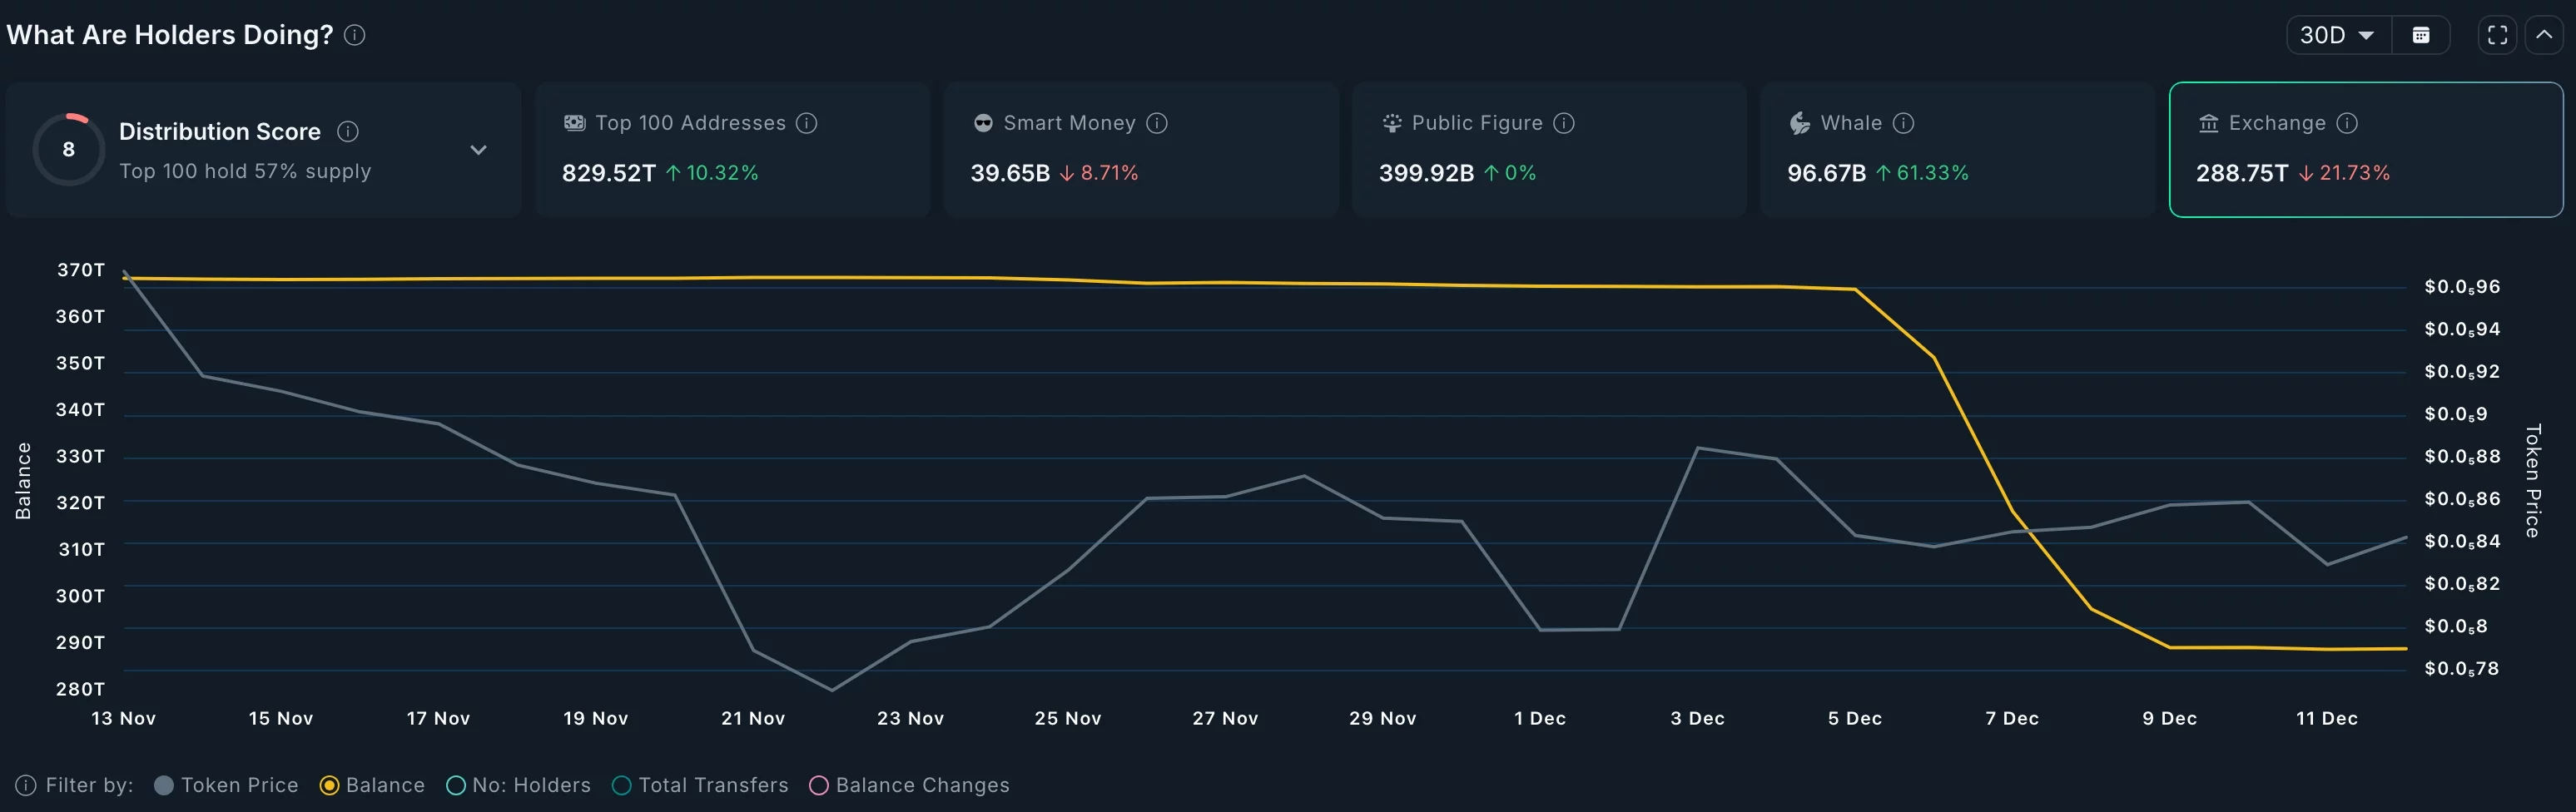
This demand is coming from whales, who have suddenly started buying. These investors now hold 96.67 billion tokens, up from this week’s low of 1.36 billion. 

Therefore, a combination of falling exchange supply, whale and smart money buying, and burn rate means that the token may rebound soon.

SHIB price technical analysis 

Shiba Inu price chart

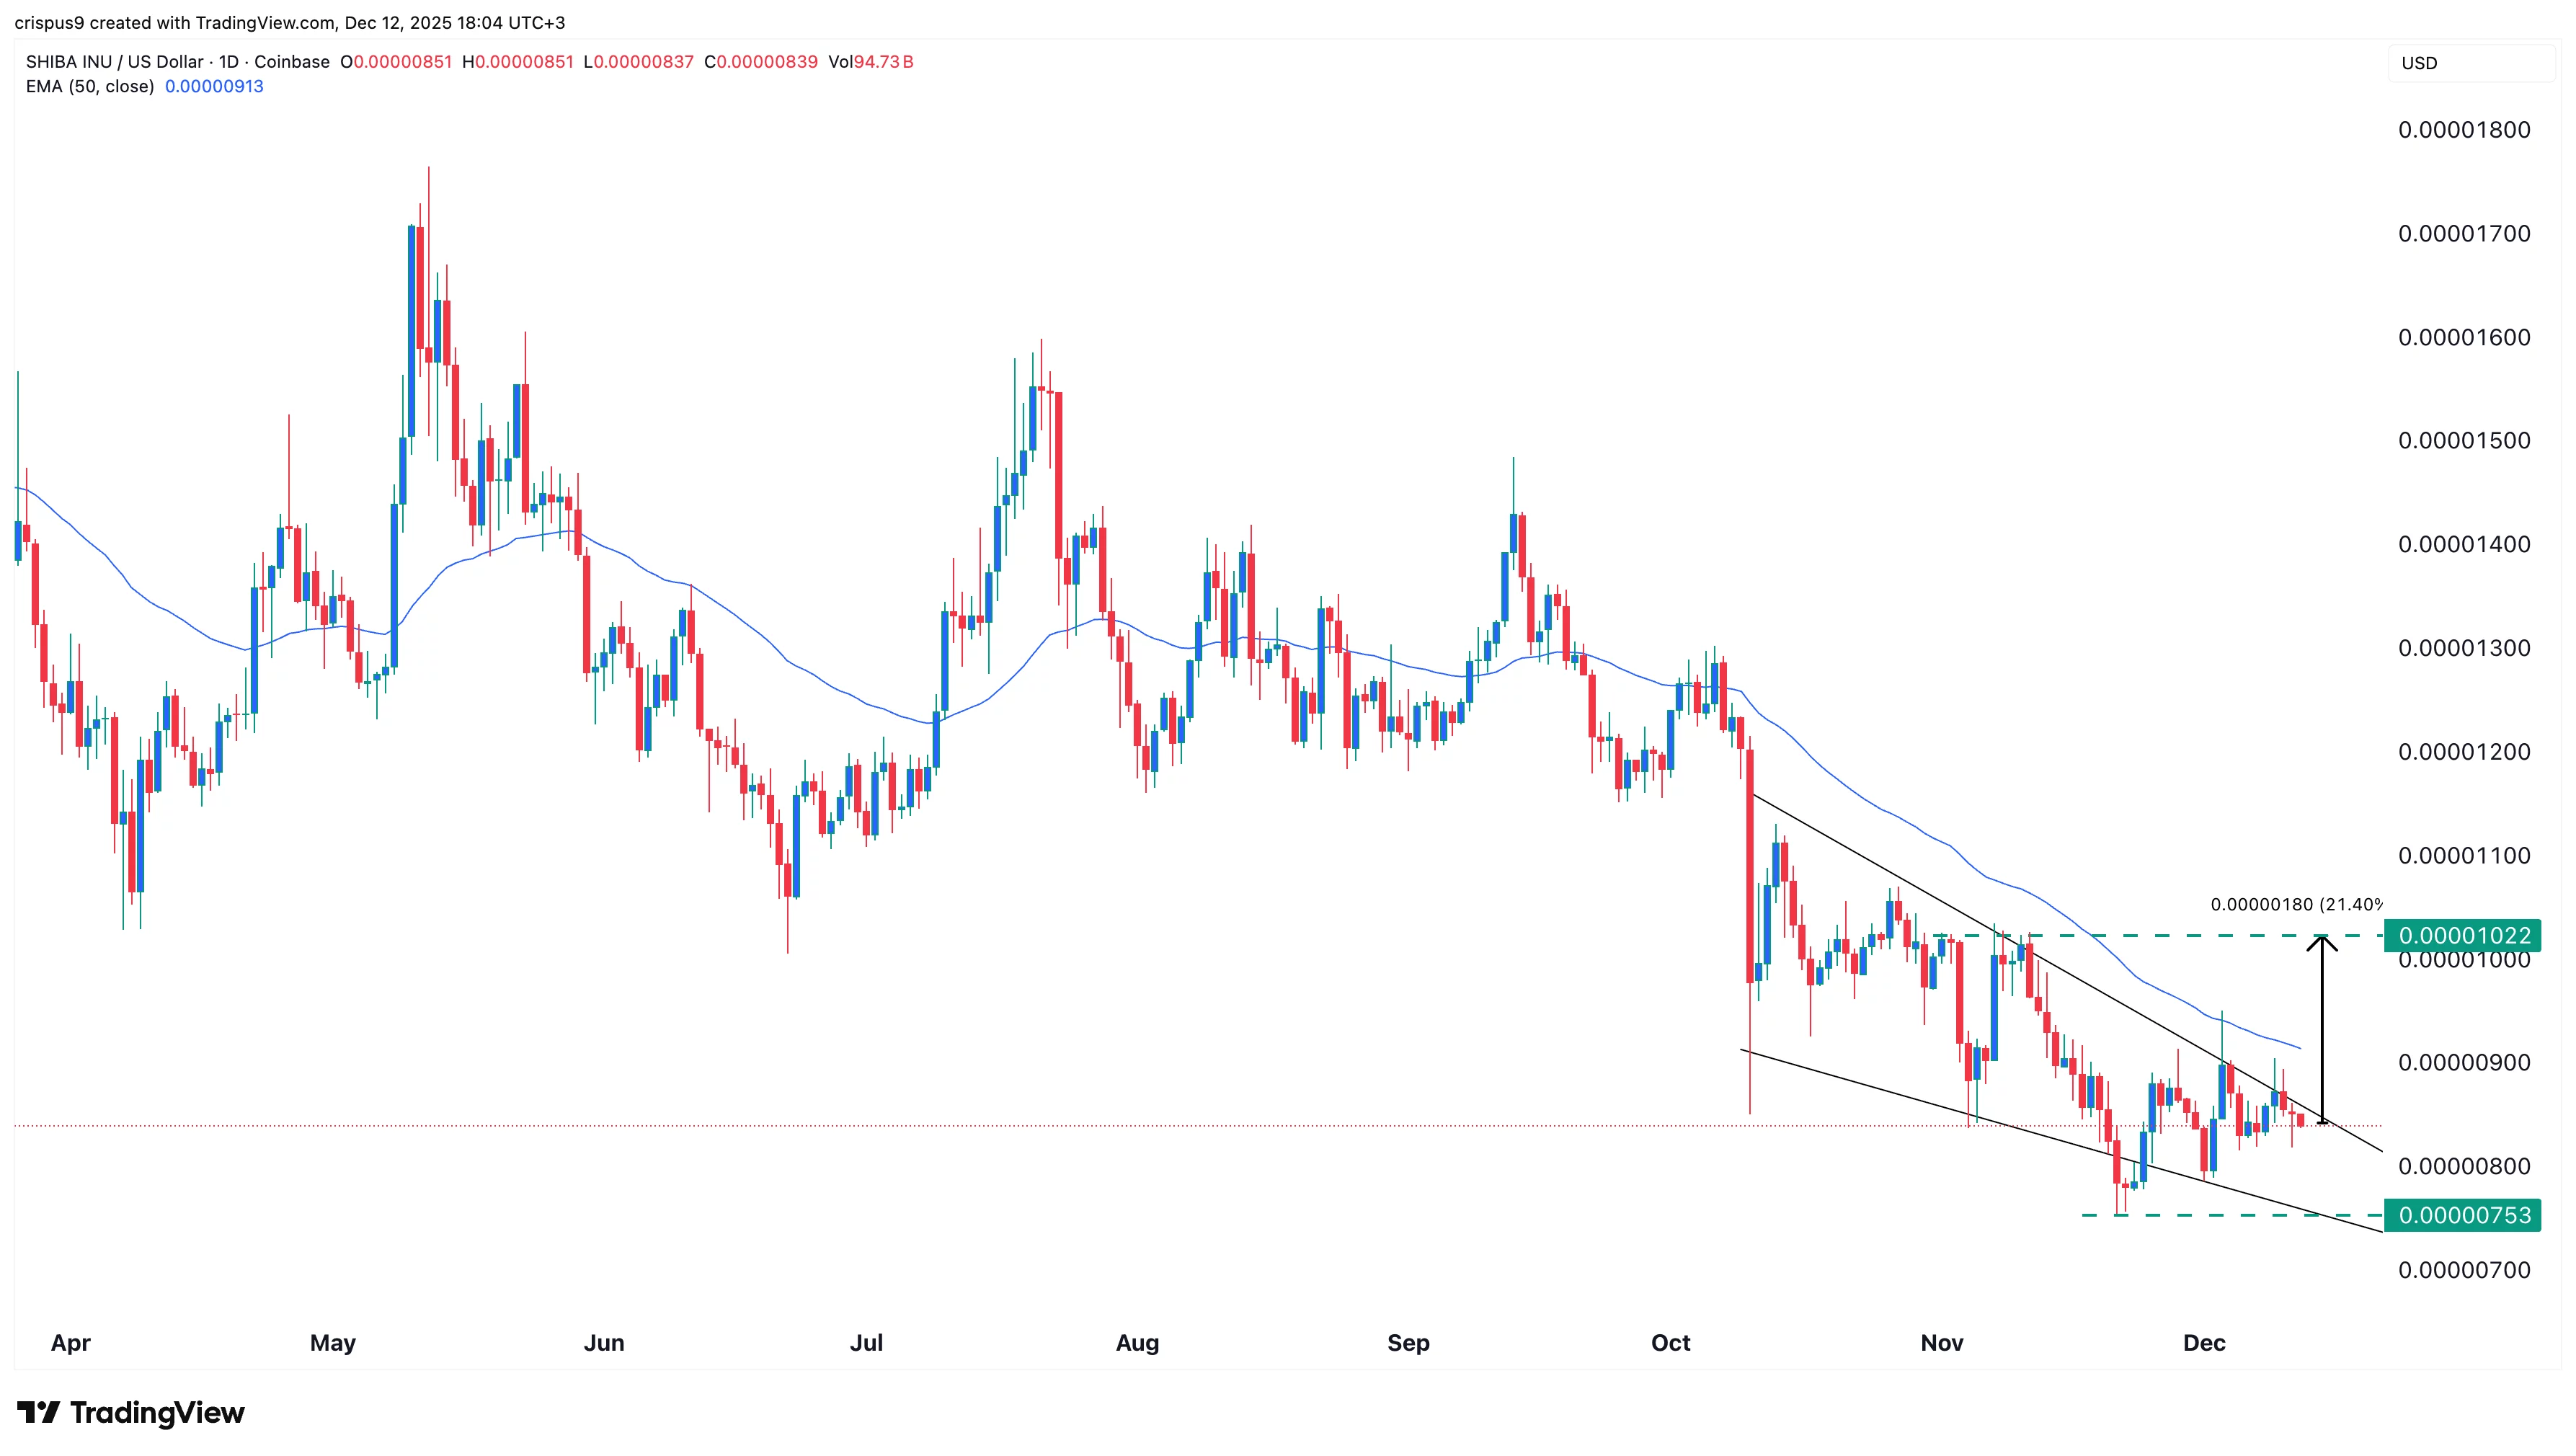
Technicals suggest that Shiba Inu Coin price bottomed at $0.0000075 in November and then rebounded to the current $0.0000084.

A closer look shows that the token has formed a falling wedge pattern and is slightly below the upper side. It has also formed a small inverted head-and-shoulders pattern, another highly bullish chart pattern.

Therefore, the Shiba Inu price will likely rebound, potentially to the significant resistance level at $0.000010, approximately 20% above the current level. This view will be confirmed if it moves above the 50-day moving average and the upper side of the descending wedge.

Disclaimer: The articles reposted on this site are sourced from public platforms and are provided for informational purposes only. They do not necessarily reflect the views of MEXC. All rights remain with the original authors. If you believe any content infringes on third-party rights, please contact service@support.mexc.com for removal. MEXC makes no guarantees regarding the accuracy, completeness, or timeliness of the content and is not responsible for any actions taken based on the information provided. The content does not constitute financial, legal, or other professional advice, nor should it be considered a recommendation or endorsement by MEXC.

You May Also Like

BlackRock boosts AI and US equity exposure in $185 billion models

BlackRock boosts AI and US equity exposure in $185 billion models

The post BlackRock boosts AI and US equity exposure in $185 billion models appeared on BitcoinEthereumNews.com. BlackRock is steering $185 billion worth of model portfolios deeper into US stocks and artificial intelligence. The decision came this week as the asset manager adjusted its entire model suite, increasing its equity allocation and dumping exposure to international developed markets. The firm now sits 2% overweight on stocks, after money moved between several of its biggest exchange-traded funds. This wasn’t a slow shuffle. Billions flowed across multiple ETFs on Tuesday as BlackRock executed the realignment. The iShares S&P 100 ETF (OEF) alone brought in $3.4 billion, the largest single-day haul in its history. The iShares Core S&P 500 ETF (IVV) collected $2.3 billion, while the iShares US Equity Factor Rotation Active ETF (DYNF) added nearly $2 billion. The rebalancing triggered swift inflows and outflows that realigned investor exposure on the back of performance data and macroeconomic outlooks. BlackRock raises equities on strong US earnings The model updates come as BlackRock backs the rally in American stocks, fueled by strong earnings and optimism around rate cuts. In an investment letter obtained by Bloomberg, the firm said US companies have delivered 11% earnings growth since the third quarter of 2024. Meanwhile, earnings across other developed markets barely touched 2%. That gap helped push the decision to drop international holdings in favor of American ones. Michael Gates, lead portfolio manager for BlackRock’s Target Allocation ETF model portfolio suite, said the US market is the only one showing consistency in sales growth, profit delivery, and revisions in analyst forecasts. “The US equity market continues to stand alone in terms of earnings delivery, sales growth and sustainable trends in analyst estimates and revisions,” Michael wrote. He added that non-US developed markets lagged far behind, especially when it came to sales. This week’s changes reflect that position. The move was made ahead of the Federal…
Share
BitcoinEthereumNews2025/09/18 01:44