Major crash or a rebound: what's next for SOL?Major crash or a rebound: what's next for SOL?

Solana (SOL) Price Alert: Is a 50% Collapse on the Way?

2025/12/16 02:44

Solana (SOL) witnessed substantial gains in late summer, but over the past several months, it has been in a steep decline.

According to some renowned analysts, the asset may experience a further collapse in the short term, with sub-$70 levels now in focus.

Brutal Crash on the Horizon?

The X user, Ali Martinez, observed SOL’s performance from March 2024 until now. He believes the price structure resembles a textbook “head and shoulders” pattern, with the head taking shape late last year when Solana reached $240.

Based on this formation, Martinez argued that the valuation could continue to sink to as low as $66.20, representing a 50% collapse from the current $132 mark.

“Head and shoulders” is a bearish pattern and forms when the price makes three peaks. The first is the left shoulder, the second is the head, and the third is the right shoulder. If the valuation breaks below a critical support level, known as “the neckline,” traders view it as a sign of further decline.

Martinez isn’t the only analyst envisioning bearish times for SOL. X user Crypto Tony suggested there might be a minor uptick to $134, followed by a plunge.

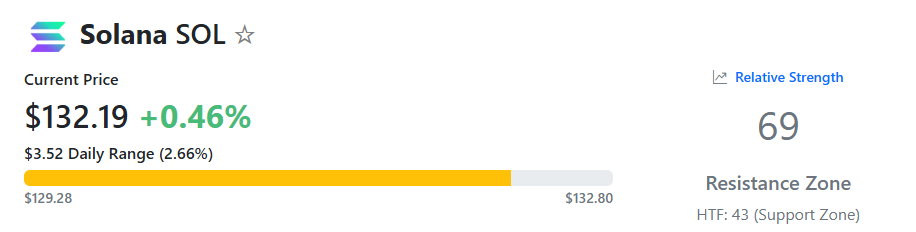
Meanwhile, SOL is nearing overbought territory, which indicates additional problems for the bulls. The asset’s Relative Strength Index (RSI) measures the speed and magnitude of the token’s recent price changes and ranges from 0 to 100. Anything above 70 is considered bearish territory, while readings below 30 could be interpreted as a buying opportunity. SOL’s current RSI stands at around 69.

SOL RSISOL RSI, Source: RSI Hunter

The Bullish Scenario

Despite the downtrend and the pessimism coming from the aforementioned analysts, others think SOL could still stage a comeback. X user TraderSZ (who has almost 700,000 followers) predicted the price might surpass $160 in the following days, while James set a potential target of $152.

SOL’s recent exchange netflow supports the optimistic theories. Over the past several months, outflows have significantly exceeded inflows, meaning investors have switched from centralized platforms to self-custody methods. This is considered bullish since it reduced the immediate selling pressure. On the contrary, flocking to exchanges is typically seen as the move before a massive cash out.

SOL Exchange Netflow
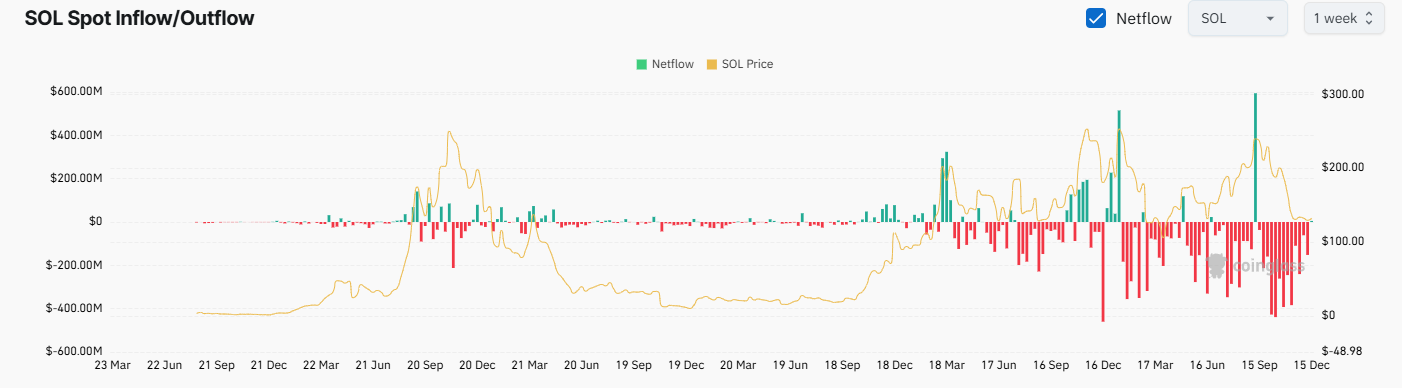
SOL Exchange Netflow, Source: CoinGlass

The post Solana (SOL) Price Alert: Is a 50% Collapse on the Way? appeared first on CryptoPotato.

Market Opportunity
Solana Logo
Solana Price(SOL)
$128.36
$128.36$128.36
+1.15%
USD
Solana (SOL) Live Price Chart
Disclaimer: The articles reposted on this site are sourced from public platforms and are provided for informational purposes only. They do not necessarily reflect the views of MEXC. All rights remain with the original authors. If you believe any content infringes on third-party rights, please contact service@support.mexc.com for removal. MEXC makes no guarantees regarding the accuracy, completeness, or timeliness of the content and is not responsible for any actions taken based on the information provided. The content does not constitute financial, legal, or other professional advice, nor should it be considered a recommendation or endorsement by MEXC.

You May Also Like

XRP Price Prediction: Can Ripple Rally Past $2 Before the End of 2025?

XRP Price Prediction: Can Ripple Rally Past $2 Before the End of 2025?

The post XRP Price Prediction: Can Ripple Rally Past $2 Before the End of 2025? appeared first on Coinpedia Fintech News The XRP price has come under enormous pressure
Share
CoinPedia2025/12/16 19:22
BlackRock boosts AI and US equity exposure in $185 billion models

BlackRock boosts AI and US equity exposure in $185 billion models

The post BlackRock boosts AI and US equity exposure in $185 billion models appeared on BitcoinEthereumNews.com. BlackRock is steering $185 billion worth of model portfolios deeper into US stocks and artificial intelligence. The decision came this week as the asset manager adjusted its entire model suite, increasing its equity allocation and dumping exposure to international developed markets. The firm now sits 2% overweight on stocks, after money moved between several of its biggest exchange-traded funds. This wasn’t a slow shuffle. Billions flowed across multiple ETFs on Tuesday as BlackRock executed the realignment. The iShares S&P 100 ETF (OEF) alone brought in $3.4 billion, the largest single-day haul in its history. The iShares Core S&P 500 ETF (IVV) collected $2.3 billion, while the iShares US Equity Factor Rotation Active ETF (DYNF) added nearly $2 billion. The rebalancing triggered swift inflows and outflows that realigned investor exposure on the back of performance data and macroeconomic outlooks. BlackRock raises equities on strong US earnings The model updates come as BlackRock backs the rally in American stocks, fueled by strong earnings and optimism around rate cuts. In an investment letter obtained by Bloomberg, the firm said US companies have delivered 11% earnings growth since the third quarter of 2024. Meanwhile, earnings across other developed markets barely touched 2%. That gap helped push the decision to drop international holdings in favor of American ones. Michael Gates, lead portfolio manager for BlackRock’s Target Allocation ETF model portfolio suite, said the US market is the only one showing consistency in sales growth, profit delivery, and revisions in analyst forecasts. “The US equity market continues to stand alone in terms of earnings delivery, sales growth and sustainable trends in analyst estimates and revisions,” Michael wrote. He added that non-US developed markets lagged far behind, especially when it came to sales. This week’s changes reflect that position. The move was made ahead of the Federal…
Share
BitcoinEthereumNews2025/09/18 01:44
DMCC and Crypto.com Partner to Explore Blockchain Infrastructure for Physical Commodities

DMCC and Crypto.com Partner to Explore Blockchain Infrastructure for Physical Commodities

The Dubai Multi Commodities Centre and Crypto.com have announced a partnership to explore on-chain infrastructure for physical commodities including gold, energy, and agricultural products. The collaboration brings together one of the world's leading free trade zones with a global cryptocurrency exchange, signaling serious institutional interest in commodity tokenization.
Share
MEXC NEWS2025/12/16 20:46