Bitcoin Price Analysis: BTC Breakout Targets $100K as Bulls Regain Control
TLDR
- BTC confirms a falling wedge breakout, opening upside toward $100K–$105K if support holds.
- Weekly structure remains bullish above $80K, framing pullbacks as corrective within the uptrend.
- Volume expansion supports the breakout, signaling renewed buyer strength after consolidation.
- Liquidity clusters near $88K and $92K suggest heightened volatility and potential liquidation-driven moves.
Bitcoin price is showing renewed bullish momentum as multiple technical signals align across short- and long-term charts. Analysts point to a confirmed breakout pattern, resilient macro structure, and concentrated liquidity zones that could drive volatility. Based on current setups, upside targets between $95,000 and $105,000 are coming into focus if key levels continue to hold.
Falling Wedge Breakout Signals Bitcoin Price Upside
According to analyst CRYPTOWZRD, the daily BTC chart confirms a breakout from a falling wedge that formed since mid-2025. This pattern featured lower highs and lower lows with declining downside momentum, often associated with trend reversals. The breakout above the upper trendline near $90,000 signals increasing buyer strength following prolonged compression.
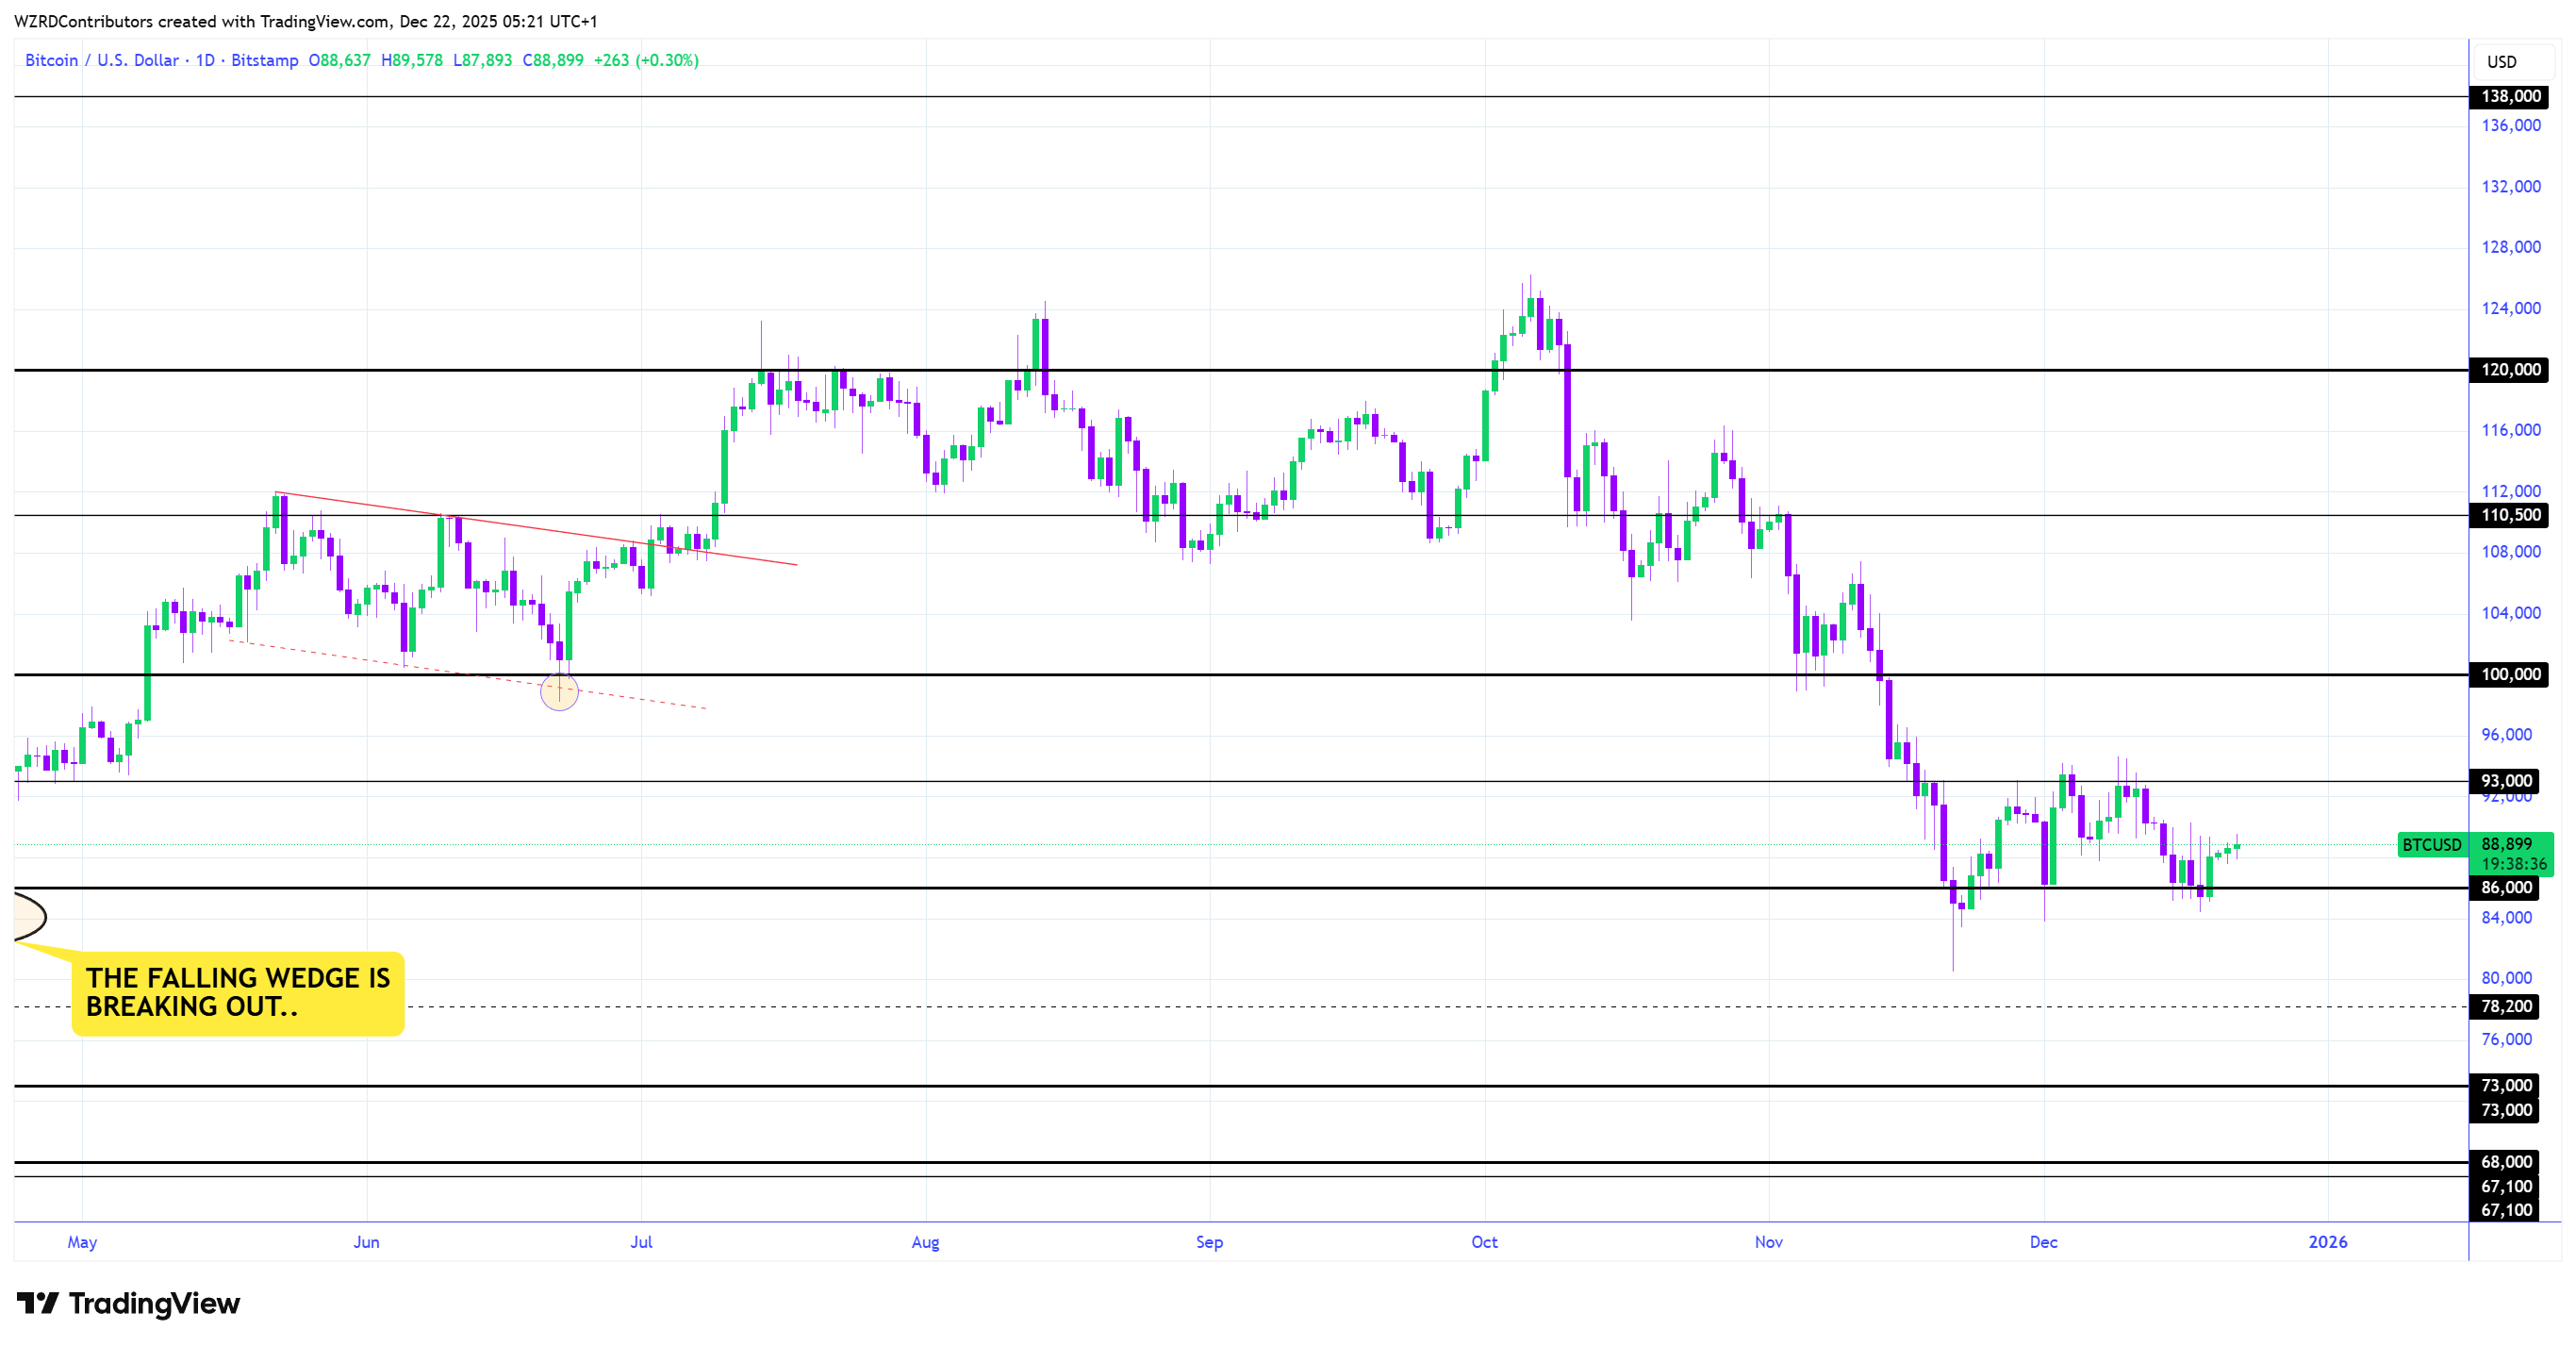
Furthermore, volume behavior gives the move credibility. Trading activity contracted during wedge formation, then expanded as the price pushed higher, consistent with a bullish resolution. With Bitcoin price trading near $88,700, the breakout remains valid as long as the price holds above the $88,000 level. Technical projections from the wedge height suggest upside extension toward the $100,000–$105,000 zone if momentum persists.
Weekly Trend Structure Remains Firm Above Key Support
Meanwhile, analyst Jelle highlighted the weekly structure, which continues to favor bulls. The Bitcoin chart from 2023 through 2026 shows price advancing within a steep ascending channel. Despite recent volatility, higher lows remain intact, and the $80,000 level continues to act as a major structural floor.
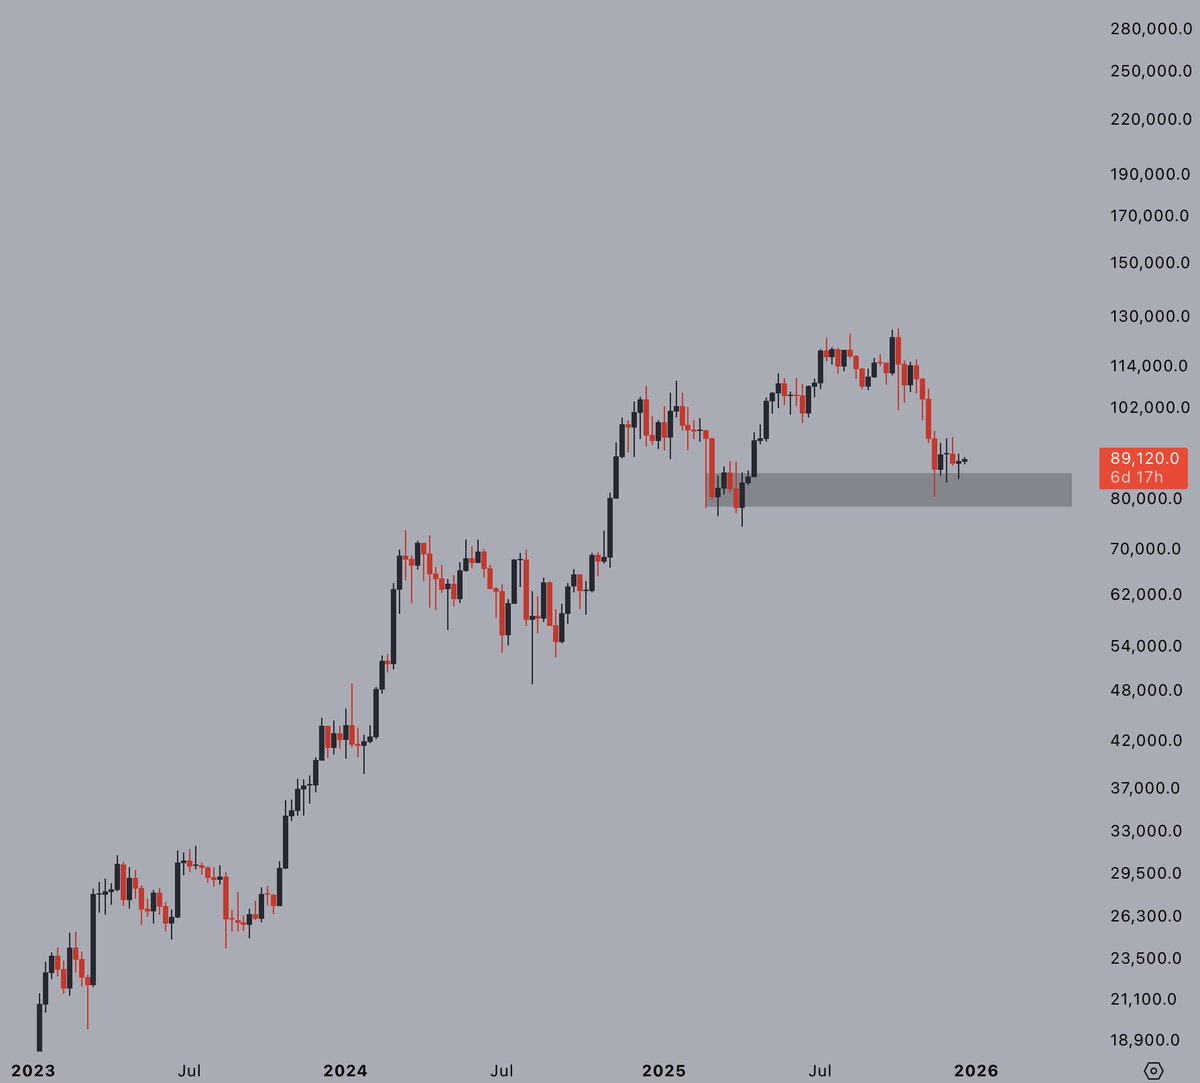
This perspective frames the recent pullback as a mid-cycle correction rather than a trend failure. More so, volume has remained steady during advances, suggesting sustained accumulation during dips. As long as Bitcoin price remains above $80,000, the macro bias points higher, with longer-term targets extending toward the $110,000–$120,000 zone in the next phase.
Additionally, momentum indicators show no major bearish divergence on the weekly timeframe. Similar pullbacks occurred during previous bull cycles before a continuation higher. These conditions reinforce the view that weakness remains corrective within an ongoing uptrend.
Notably, a breakdown below the ascending channel would change this outlook and expose deeper downside risks. However, current price behavior continues to respect channel support.
Liquidation Heatmap Flags Volatility Triggers Ahead
In addition, analyst Gerla’s 24-hour liquidation heatmap highlights zones of heightened leverage risk. The visualization shows dense liquidity clusters both above $90,000 and below $88,000. These zones represent levels where forced liquidations could accelerate price movement.
A sustained push above $92,000 could trigger short liquidations, potentially driving Bitcoin price toward $95,000. Conversely, a drop below $88,000 risks flushing leveraged longs toward the $84,000 region. Liquidity below that level appears thinner, suggesting deeper declines may be limited if buyers defend support.
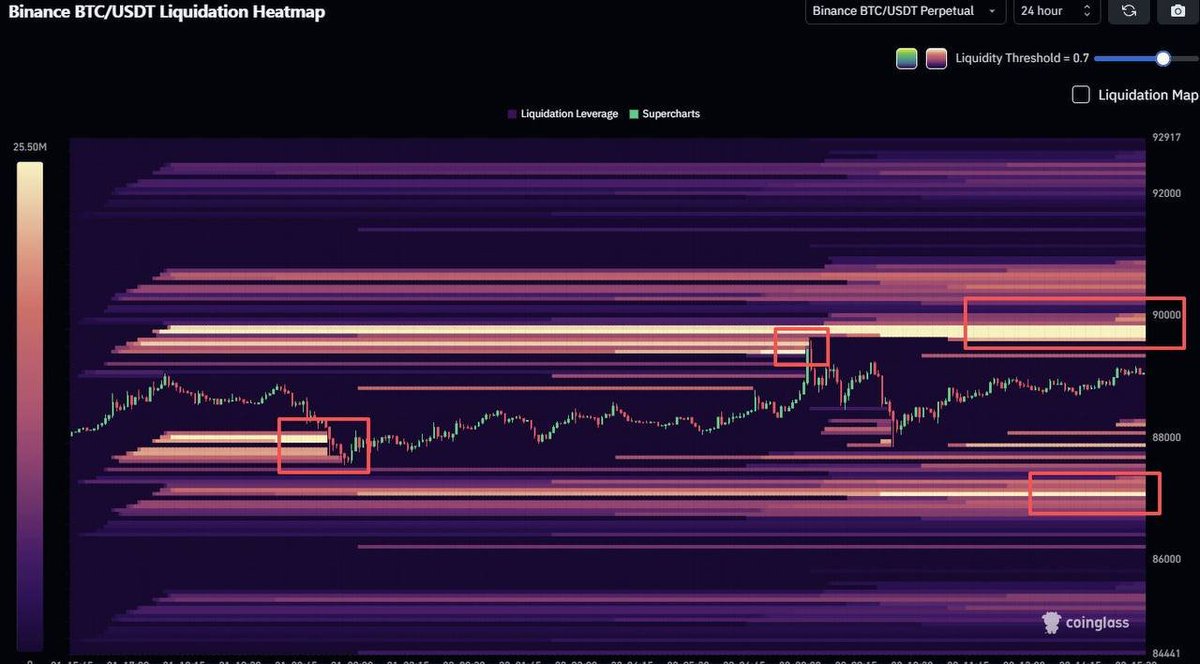
The heatmap underscores a market primed for expansion rather than stagnation. Overleveraged positions on both sides increase the likelihood of sharp moves once price exits the current range. Until resolution occurs, volatility is likely to remain elevated near these liquidity thresholds.
Combined, technical structure, trend strength, and positioning data suggest Bitcoin price is at a pivotal juncture. At the time of reporting, BTC trades near $89,000, with $88,000 acting as immediate support and $95,000 as the next upside checkpoint.
The post Bitcoin Price Analysis: BTC Breakout Targets $100K as Bulls Regain Control appeared first on CoinCentral.


You May Also Like

One Of Frank Sinatra’s Most Famous Albums Is Back In The Spotlight

Not a loophole: Singapore AI export controls let China tap US AI legally

Q2 Market Insights: Bitcoin regains dominance in risk-averse environment, ETFs remain critical to market structure