

BNB Daily Chart: Pressure Below Key Averages While the Market Hides in Stablecoins

Market conditions remain fragile as BNB trades under important daily moving averages while traders crowd into stablecoins and risk sentiment stays defensive.
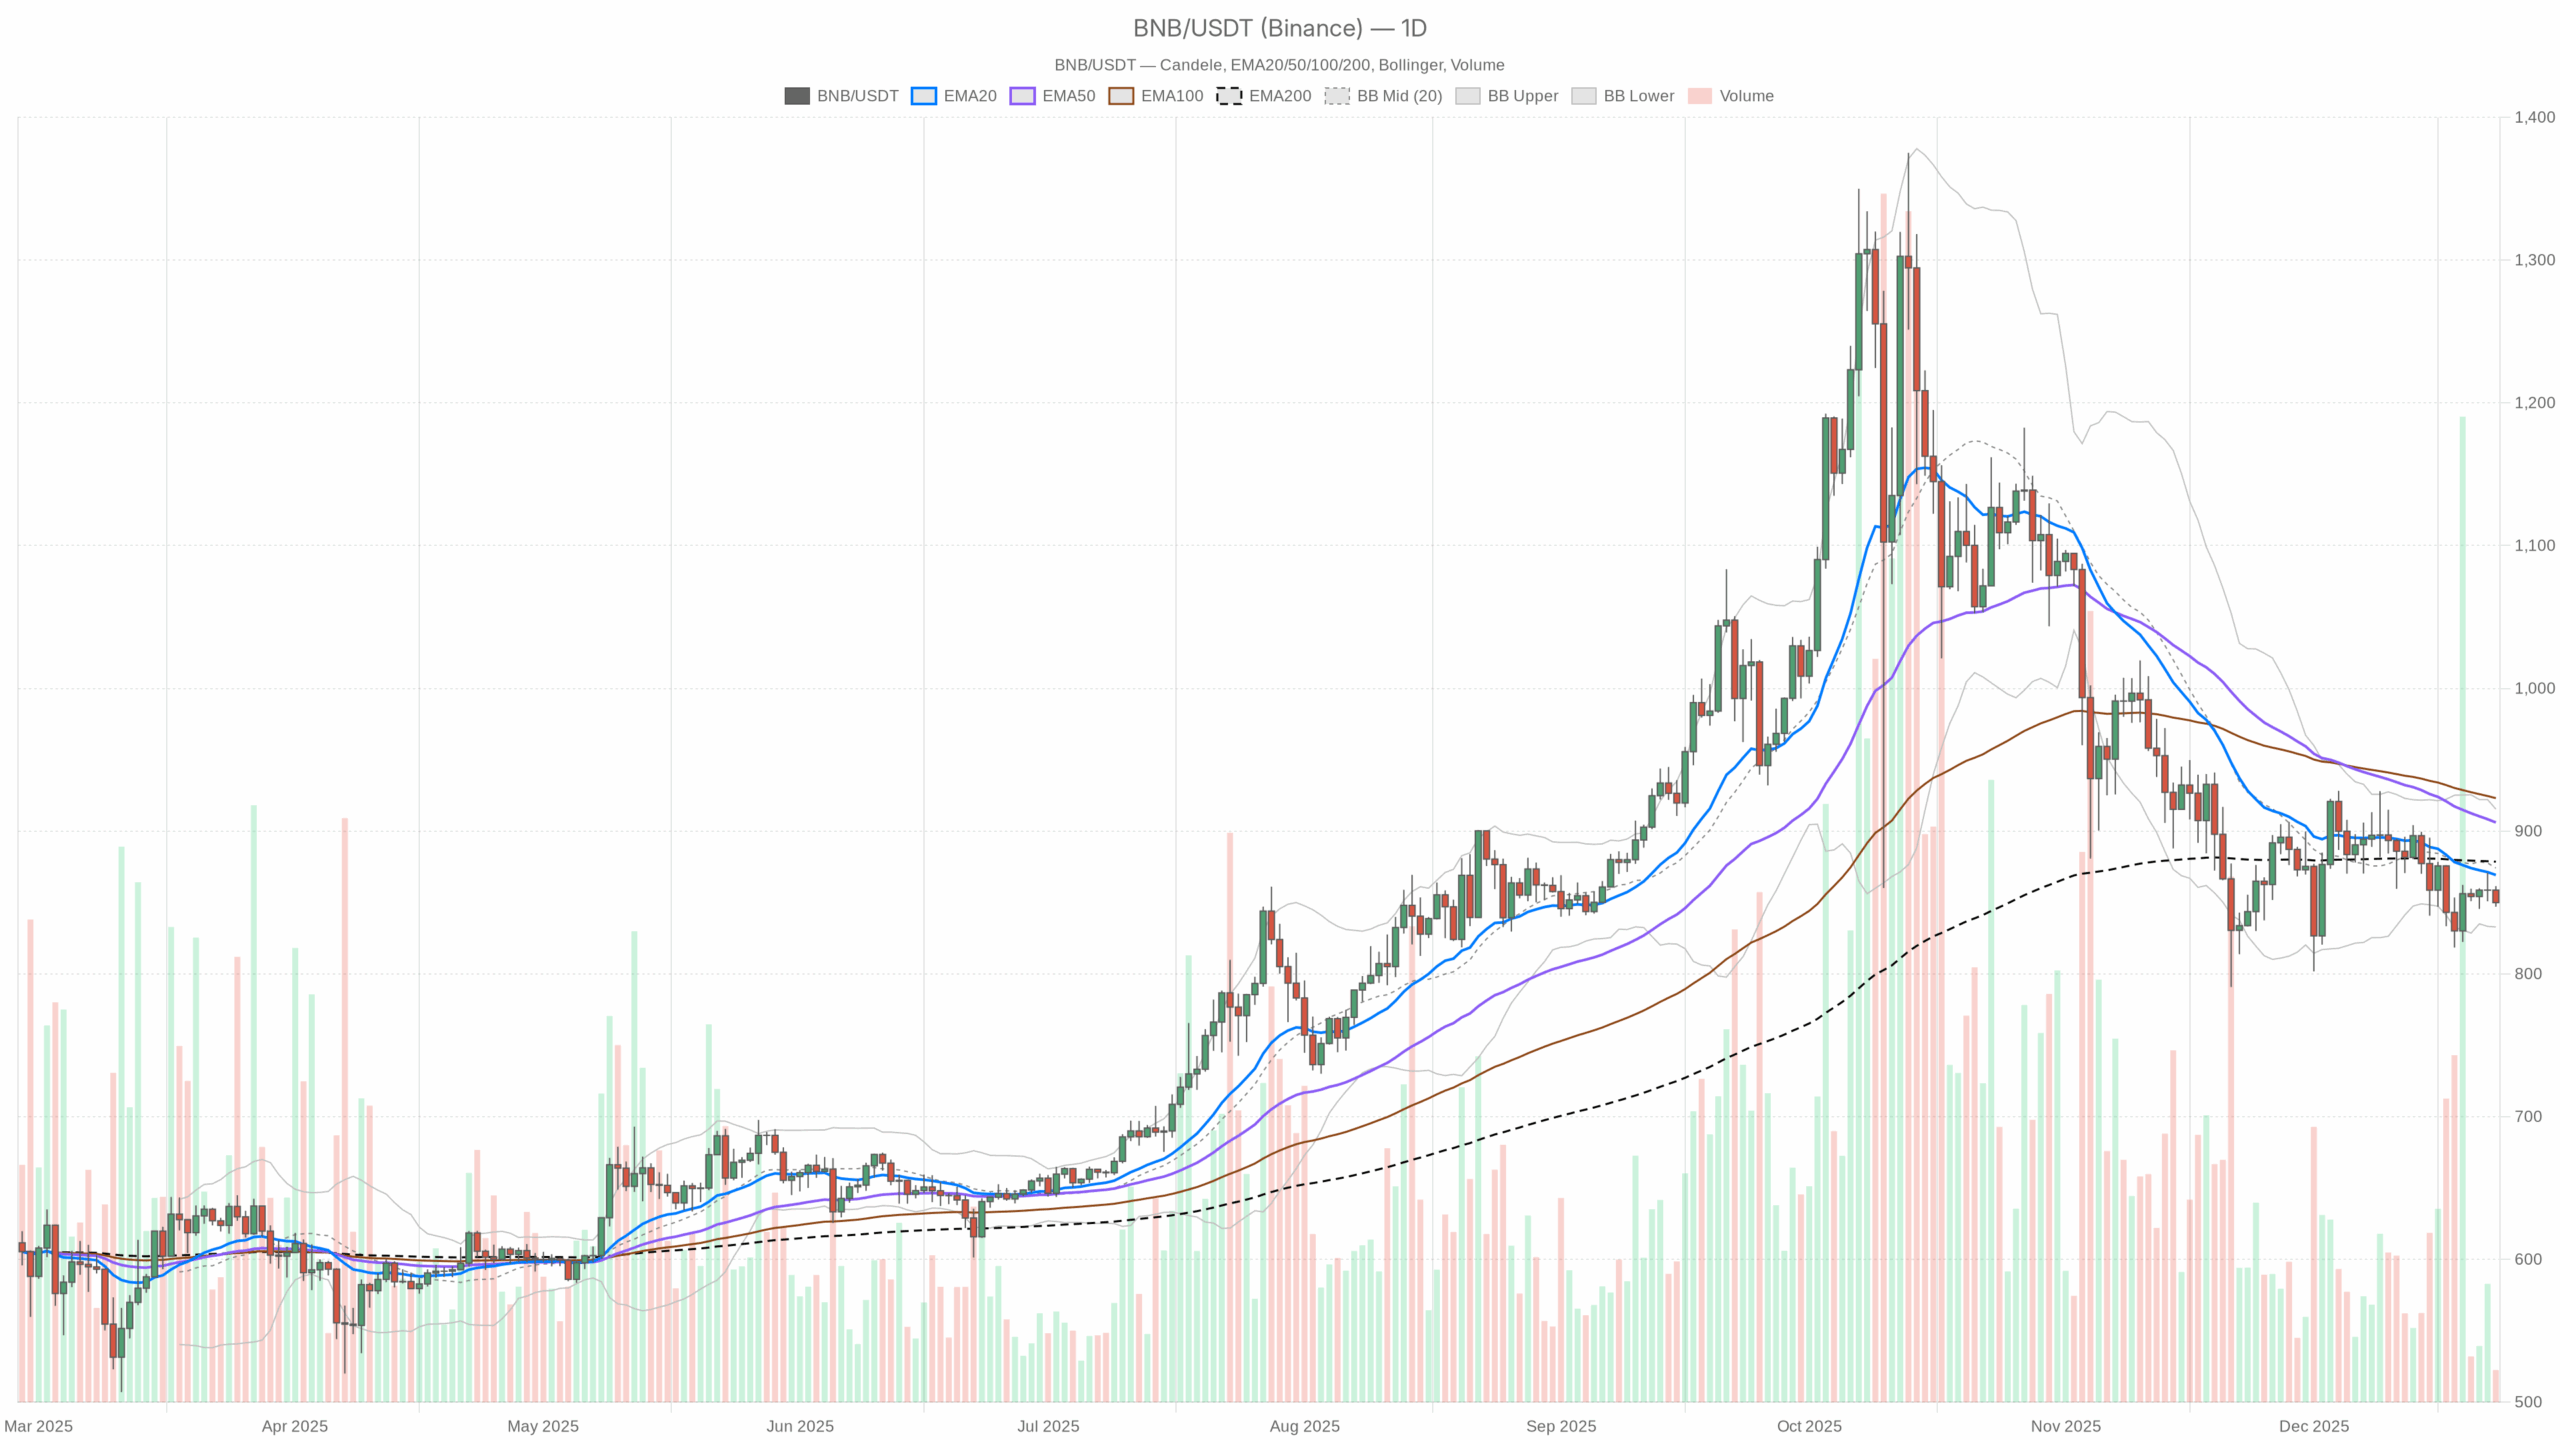 BNB/USDT — daily chart with candlesticks, EMA20/EMA50 and volume.
Daily Bias (D1): Slightly Bearish / Sideways Under Resistance
On the daily, BNB closed around 849.9, below all the key EMAs and just above the lower Bollinger Band. That puts the main scenario at cautiously bearish-to-neutral: the market is correcting within a broader range, not yet collapsing, but buyers clearly are not in full control.
Daily EMAs (Trend & Structure)
– EMA 20: 869.25
– EMA 50: 906.06
– EMA 200: 878.61
– Price (close): 849.92
All the key EMAs sit above price, with the 20-day below the 200-day and the 50-day above both. This is a messy structure rather than a clean uptrend or downtrend. Price trading under the 20/50/200 tells us the short- and medium-term crowd has stepped back from aggressive buying. For now, BNB is trading in a corrective pocket below resistance, not yet in a full long-term downtrend, but definitely not in a healthy bull leg.
Daily RSI (Momentum & Participation)
– RSI 14: 42.43
RSI sitting in the low 40s is classic weak momentum territory. It is not oversold, so there is no strong panic low yet, but it does confirm sellers have the upper hand. Buyers are nibbling, not stampeding. This type of RSI often aligns with slow, grinding pullbacks rather than violent reversals.
Daily MACD (Trend Confirmation)
– MACD line: -15.09
– Signal line: -15.47
– Histogram: 0.38
The MACD is negative but with a small positive histogram. That means the downtrend pressure that pushed BNB lower is losing intensity, but has not flipped bullish. Bears are no longer pressing as hard, yet bulls have not taken the ball. It is consistent with a market trying to stabilize after a drop, but still trading below its key averages.
Daily Bollinger Bands (Volatility & Range)
– Middle band: 874.13
– Upper band: 915.41
– Lower band: 832.85
– Price: 849.92
Price is hovering closer to the lower band than the middle, inside the band. This tells us BNB is in the lower half of its recent range but not in a volatility blowout. There has been downside pressure, but it is controlled, not capitulation. That is typically a mean-reversion zone where either a bounce toward the mid-band starts, or a second leg down begins if sentiment worsens.
Daily ATR (Risk & Volatility)
– ATR 14: 29.03
An ATR around 29 on an approximately 850 asset points to moderate daily swings of about 3–3.5%. Volatility is elevated enough to hurt tight stops but not in full panic mode. For traders, this is a market where position sizing matters, because one bad daily candle can easily wipe out a poorly sized leveraged bet.
Daily Pivot Levels (Short-Term Reference)
– Pivot point (PP): 852.81
– R1: 858.57
– S1: 844.17
Price closed just below the daily pivot, sandwiched between PP and S1. That is a balanced but slightly heavy posture: sellers are nudging price below the equilibrium line, but they have not forced a clear breakdown. As long as BNB stays below the pivot cluster, intraday rallies are more likely to be sold into.
Intraday Confirmation: H1 & M15 Tilt Bearish
H1 Chart: Short-Term Sellers in Control
– Close: 850.08
– EMA 20: 855.00
– EMA 50: 856.18
– EMA 200: 858.92
– RSI 14: 38.07
– MACD: line -2.81, signal -1.64, hist -1.17
– Bollinger mid: 857.12 (bands: 844.64–869.59)
– ATR 14: 3.69
– Pivot PP: 850.05 (price sitting right on it)
On the hourly, all EMAs are stacked above price and gently pointing down. That is a clean short-term downtrend. RSI near 38 shows persistent selling, and the negative MACD histogram confirms active downside momentum. Price hugging the hourly pivot from below reinforces that intraday rallies are being capped quickly. This timeframe supports the bearish or neutral daily bias, not a fresh bullish impulse.
M15 Chart: Micro Bounces Inside a Bearish Structure
– Close: 850.09
– EMA 20: 850.46
– EMA 50: 853.44
– EMA 200: 856.58
– RSI 14: 43.89
– MACD: line -1.25, signal -1.65, hist 0.40
– Bollinger mid: 849.55 (bands: 847.51–851.58)
– ATR 14: 1.31
– Pivot PP: 850.07
On 15 minutes, price is sitting right at the pivot and just under the 20 EMA, with the 50 and 200 EMAs higher. RSI in the low 40s and a small positive MACD histogram tell a nuanced story: short bursts of buying inside a broader intraday downtrend. This is the type of environment where scalpers can catch quick bounces, but swing traders should respect that the higher intraday structure is still bearish.
Macro Context: Fear, Stablecoins, and DeFi Activity
The broader market is in risk-off mode. The crypto fear and greed index sits at 24 (Extreme Fear), and total market cap is down about 2.1% over 24 hours. BTC dominance north of 57% means capital is crowding into the relative safety of Bitcoin. Moreover, stablecoins such as USDT and USDC still hold meaningful shares of market cap. For an exchange token like BNB, that usually translates into subdued speculative interest and thinner follow-through on rallies.
On the DeFi side, major DEXes such as PancakeSwap and Uniswap have seen monthly fee declines but some short-term bumps in daily fees. PancakeSwap AMM in particular shows a sharp one-day fee spike after a steep seven-day drop. That pattern often reflects bursts of reactive trading, not sustained risk-on flow. So even where BNB has structural ties, like BSC DeFi, the backdrop does not suggest strong, sustained demand.
Scenarios for BNB
Bullish Scenario: Mean Reversion Back Above 880–900
For bulls, the base case is a mean-reversion bounce off the lower half of the Bollinger Bands back towards the daily mid-band and EMAs.
What bulls need to see:
1. Hold above the lower band or S1 zone (830–845) on daily closes. As long as BNB defends 832.85–844, the market is saying this is corrective, not catastrophic.
2. Reclaim the daily pivot and short EMAs. First step is a sustained move above 855–860, where the H1 20 and 50 EMA and D1 pivot or R1 cluster sit. That would break the intraday downtrend.
3. Daily RSI back above 50 and MACD histogram flipping more positive. That would signal that downside momentum has genuinely faded and dip buyers are getting bolder.
4. A push toward the D1 mid-band and EMA 200 around 875–880, and eventually the EMA 50 near 906. That is where the market will decide whether this is just a relief rally or the start of a new leg higher.
What invalidates the bullish scenario?
A clean daily close below 830–835, under the lower Bollinger Band and below S1 support, with RSI sliding deeper into the 30s would invalidate the mean-reversion idea and shift the narrative to an active downtrend. If H1 continues to stack lower highs even when BTC stabilizes, bulls lose their best macro ally.
Bearish Scenario: Breakdown From the Lower Range
The bearish case is that what looks like a calm correction is actually distribution before a leg lower, amplified by ongoing risk-off sentiment across crypto.
What bears want to see:
1. Failure to reclaim 860–880. If every bounce into the H1 EMAs at 855–860 and the daily mid-range gets sold, that confirms strong supply overhead.
2. Daily close below 844, then 832. Losing S1 and sliding outside or along the lower Bollinger Band would show that sellers are willing to push into weakness, not just fade rallies.
3. RSI grinding toward 30–35 with MACD turning more negative. That would mark a transition from consolidation after a drop to a trend down. The histogram turning sharply red again would be the tell.
4. H1 and M15 staying capped below their 200 EMAs. If the short-term structure never manages to flip, shorts retain time-frame alignment in their favor.
What invalidates the bearish scenario?
If BNB can reclaim and hold above 880–890 on daily closes, back over the EMA 200 and Bollinger mid, while hourly RSI prints higher lows above 50, the idea of an imminent larger breakdown starts to lose credibility. Bears would then be facing a classic squeeze backdrop, especially if broader market fear begins to normalize.
Neutral / Range-Bound Scenario: Chop Between 830 and 900
Given the conflicting signals, with daily momentum soft but stabilizing and clearly bearish intraday flows, a neutral, range-bound path is very plausible. In that case, BNB trades roughly between 830 and 900 while the market waits for a macro catalyst such as regulation headlines, BTC volatility, or exchange-related news.
In a range scenario, indicators will stay indecisive. RSI oscillates between 40 and 55, MACD hovers near zero, and price continues to ping-pong between the lower band and the mid-band without real trend extension either way. The tape becomes a two-sided market where breakout trades repeatedly fail, rewarding only disciplined range traders.
Positioning, Risk, and Uncertainty
Right now, the main scenario is mildly bearish on the daily, confirmed by the hourly downtrend, with room for a mean-reversion bounce if 830–845 holds. This is not an environment where blindly chasing breakouts makes sense. The market is fearful, liquidity is gravitating toward Bitcoin and stablecoins, and BNB is stuck under key moving averages.
For anyone trading this, the key questions are:
– Are you treating this as a range between 830 and 900, or betting on a trend continuation?
– Is your size compatible with a roughly 3–4% daily ATR and frequent intraday whipsaws?
– Do your entries respect the multi-timeframe structure, buying near support in a fearful market, or selling into resistance while volatility is moderate?
The chart is giving information, not certainty. Daily signals say pressure but not panic, intraday signals lean bearishly, and macro sentiment is clearly risk-off. Anyone stepping in on either side should plan for volatility spikes, failed levels, and narrative shifts as new macro or regulatory headlines hit the tape.
Open your Investing.com account
This section contains a sponsored affiliate link. We may earn a commission at no additional cost to you.
Market analysis is inherently uncertain and subject to rapid change. This article is an analytical opinion, not a recommendation to buy, sell, or hold any asset. Always make your own decisions and consider your risk tolerance carefully.


You May Also Like

Russia’s Sberbank Ready to Enter Crypto Trading as Russia Moves Toward Regulation

Trump sets April 30 deadline for Iran to propose negotiation plan


