

Bitcoin Missing Out on "Santa Rally" Amid Whales' Action Intrigue

Wall Street and precious metals cheered at the start of the "Santa Rally" period to reach new all-time highs thanks to a year-end rally across global markets, but Bitcoin has taken a back seat, falling as traders prepare for the holidays by reducing holdings in the riskiest part of the market.
Bitcoin traded just above $87,300 at publication time, down about 6.5% this year, having started 2025 at $93,000 and despite hitting a peak of over $126,000 in October.
Its price has stayed low during the holiday week, bouncing around the $90,000 level. Maintaining a constant price above $86,000 shows that the market is uncertain, but Bitcoin is struggling to restore its upward momentum below the $90,000 threshold.
Since buyers and sellers can't seem to come to an agreement, the price movement has become very narrow.
After the biggest options expiry in history in notional value on Friday, bets are for a push up towards $100,000, with several resistance levels looking like big hurdles.
Supply Cost & Bitcoin's Price
Although price levels capture attention, onchain data indicates that a more significant struggle is taking place out of sight.
As volatility diminishes, indifference has emerged as a prominent characteristic of the present landscape, with a growing number of experts candidly exploring the likelihood that the market may be shifting into a more extensive downturn.
Instead, focus is turning to the cost structures of major market players, especially large holders and users of the Binance trading platform.
Despite Bitcoin currently trading at approximately $87,000, the most critical threshold is notably above that mark. There has been a recent concentration of data around $100,500 for the typical cost basis for new significant holders, defined as those who possess coins that are less than 155 days old.
This represents a crucial equilibrium for major players who have just entered the market.
Accordingly, every tactic that aspires to $100,000 is more crucial than ever. Either a distribution phase, when larger investors want to protect their cash, or a new accumulation period, when confidence is restored, could begin at the designated level.
Based on onchain data, some of Bitcoin's supply is currently valued at a cost base that exceeds the present spot price. This may impact fluctuations if BTC makes a comeback.
According to a recent post by community analyst Maartunn on X, more than 6.6 million BTC is currently being held above the latest spot price of the cryptocurrency.
The onchain metric of interest in this context is the “Supply In Loss,” which indicates, as the name implies, the total volume of Bitcoin that is presently experiencing a net unrealized loss.
This gauge determines the latest traded price of a token by analyzing its transaction history on the blockchain. A token is seen to be losing money if its previous transfer price was higher than its current spot price.
The Supply In Loss aggregates all coins that meet this criterion to determine the overall status of the network. A corresponding indicator known as the Supply In Profit considers the availability of the contrasting type.
Almost 6.6 million BTC, or almost a third of its total supply, are currently trading at a discount to their cost base.
The most difficult period since 2023 is marked by the recent peaks in the Supply In Loss, which suggest a considerable amount of market hardship.
Typically, those experiencing losses anticipate a return to their original investment level, hoping to recover their funds.
Once this happens, some of these participants choose to withdraw, concerned that BTC may decline again shortly. This selling can create significant supply clusters above the spot price, which may serve as potential points of volatility.
Any attempt to return to higher levels may face selling pressure for Bitcoin, because a substantial portion of the supply is currently losing value.
Whales Action & Intrigue
Large Bitcoin holders were seen moving a lot of the asset in a single hour on Friday. A quick transfer of $1 billion in Bitcoin has caught many investors off guard.
The recent transactions have sparked discussions and speculation among members of the cryptocurrency community about the future prospects of the cryptocurrency market.
This is especially true given that these transactions have taken place during a crucial period in which major cryptocurrencies like Bitcoin are facing declines.
A blockchain monitoring platform tracker showed seven substantial transactions that carried a total of 13,904 Bitcoin.
The majority of the transfers were remarkably similar, each involving approximately 1,994 to 1,998 BTC, and all transactions occurred between two unidentified wallets.
The total value of the transfers amounted to approximately $1.03 billion. The absence of identifiable senders or recipients for the transfers has sparked curiosity among market observers regarding the intentions behind these transactions.
The community struggled to foretell how the mysterious transfers might affect Bitcoin's price because of this.
Spectators debated whether the move represents an attempt to sell or acquire the asset or if it is part of a larger institutional repositioning.
Some experts have linked the deals to the recent decline in Bitcoin's price, implying that big holders may be rearranging their holdings.
A significant outflow of $91.4 million was recorded in just one day at BlackRock, the leading provider of Bitcoin ETFs, highlighting the prevailing negative trend among major funds.
Technicals
According to TradingView, after a steep fall from the $120,000–$125,000 highs reached earlier in this cycle, Bitcoin is now exhibiting indications of stabilization around the $88,700 mark on the weekly chart.
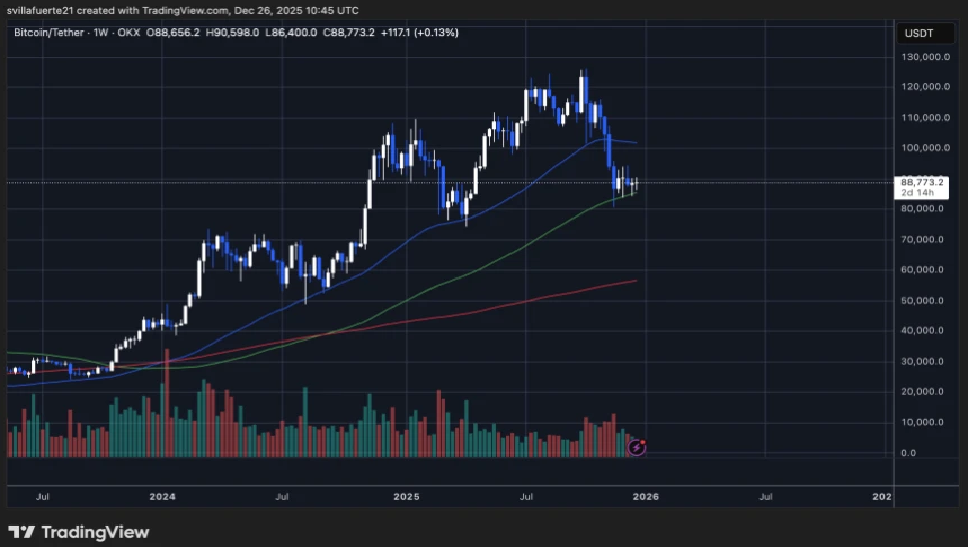
The general increasing trend that began in 2024 is still there, but the most recent price changes show that momentum has been significantly reduced.
Volatility is becoming more concentrated around an important support level as the market enters a correction and consolidation phase following a period of fast rise.
Currently, Bitcoin is maintaining its position just above the ascending medium-term moving average, which has served as a reliable support level during this bullish trend.
The setback beyond $110,000 indicates a significant loss of upward momentum, and the inability to swiftly regain that level implies a trend of distribution rather than just a temporary halt.
Simultaneously, the price continues to stay significantly above the long-term moving average, indicating that this movement is still corrective within a broader trend and has not yet established a confirmed trend reversal.
The movement in volume reinforces this understanding.
The initial breakdown saw an increase in selling pressure, yet recent weeks indicate a decrease in volume as prices have begun to stabilize within the range of approximately $86,000 to $90,000. This indicates a potential fatigue among sellers, while buyers have not yet shown a strong commitment to enter the market.
The $86,000–$88,000 range is crucial to consider. Maintaining this area preserves the positive trend on the larger timeframes. A thorough analysis would reveal significant risks ahead.
A recovery above $95,000 is essential to regain positive momentum and pave the way back to previous highs.


You May Also Like

Bitcoin’s Quantum Vulnerability: Poor Wallet Habits Expose 4.12 Million BTC

Rape joke by Bacolod broadcaster sparks outrage, suspension

SGX FX Partners With Chainlink to Bring OTC FX Data Onchain


Trending News
More24/7 Live News
MoreQuick Reads
More
