

XLM price at risk as Stellar Lumens’ funding rate crashes
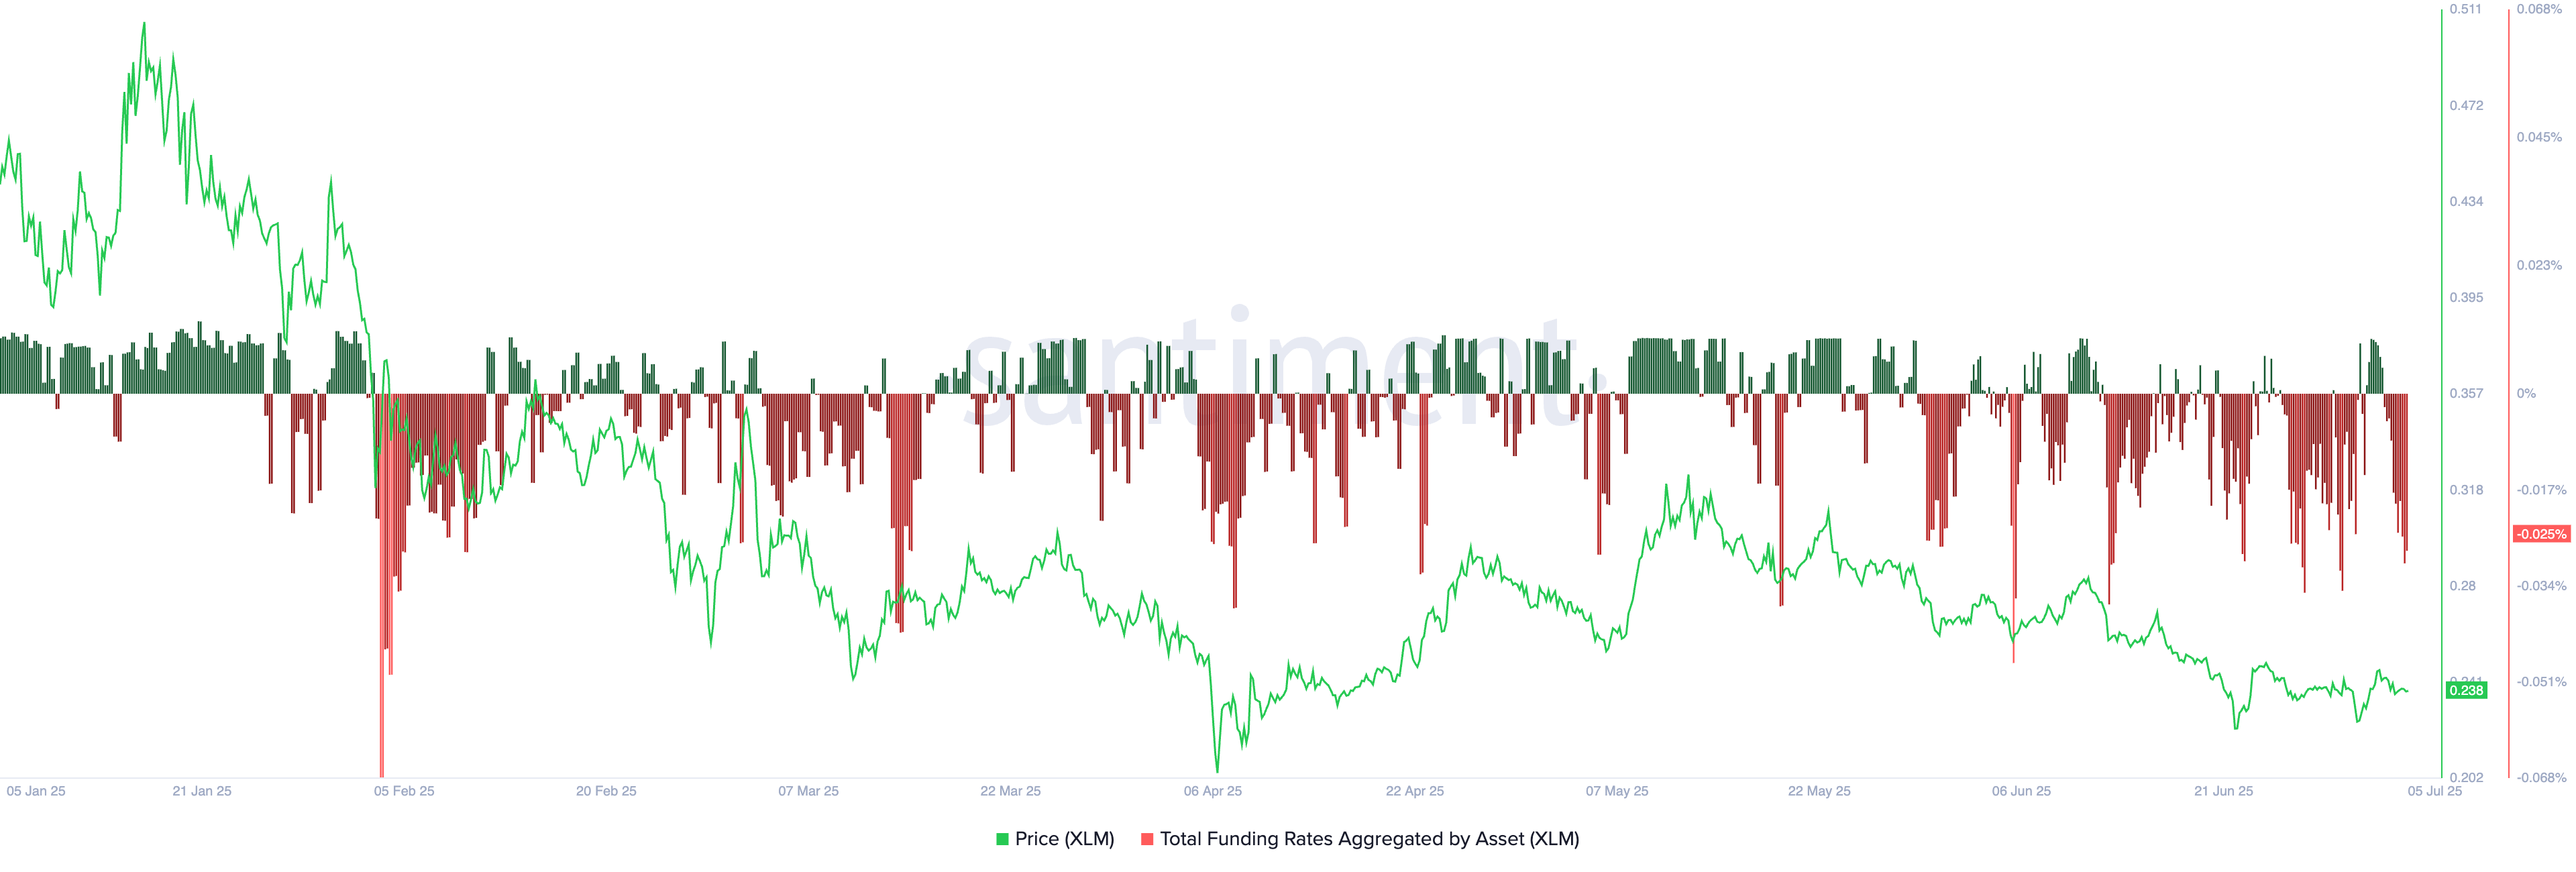
The Stellar Lumens token is at risk of further downside as its funding rate continues to decline.
Despite strong on-chain growth—rising transactions, record stablecoin supply, and expanding real-world asset tokenization—Stellar Lumens (XLM) plunged to a critical support level amid a sustained negative funding rate, suggesting growing bearish pressure.
If this support breaks, XLM could fall another 36%, underscoring the widening disconnect between network fundamentals and market sentiment.
This week, Stellar dropped to the key support at $0.2175. That’s down by 35% from its highest point in May. It has also dropped by 62% from its 2024 high.
XLM could be at risk of a steeper bearish breakdown as its funding rate crashed to its lowest level since June 30. It has remained in the negative zone on most days since May.
A funding rate is a small fee exchanged between long and short traders in perpetual futures contracts to balance the market. A negative rate means that there are more short positions than long positions, with short traders paying long traders.
Still, on the positive side, third-party data shows that the network is doing well. According to Artemis, the number of operations on Stellar rose to 197 million in June, while the stablecoin supply soared to a record high of $667 million.
Additional data indicates that the total value locked in real-world asset tokenization has risen to $487 million. It has jumped in the last five consecutive months, helped by the Franklin OnChain US Government Money Market Fund.
Meanwhile, Nansen data shows that the number of transactions jumped by 11% in the last seven days to 18.2 million. The number of active addresses in the network rose by 10% to 146,700.
XLM price technical analysis
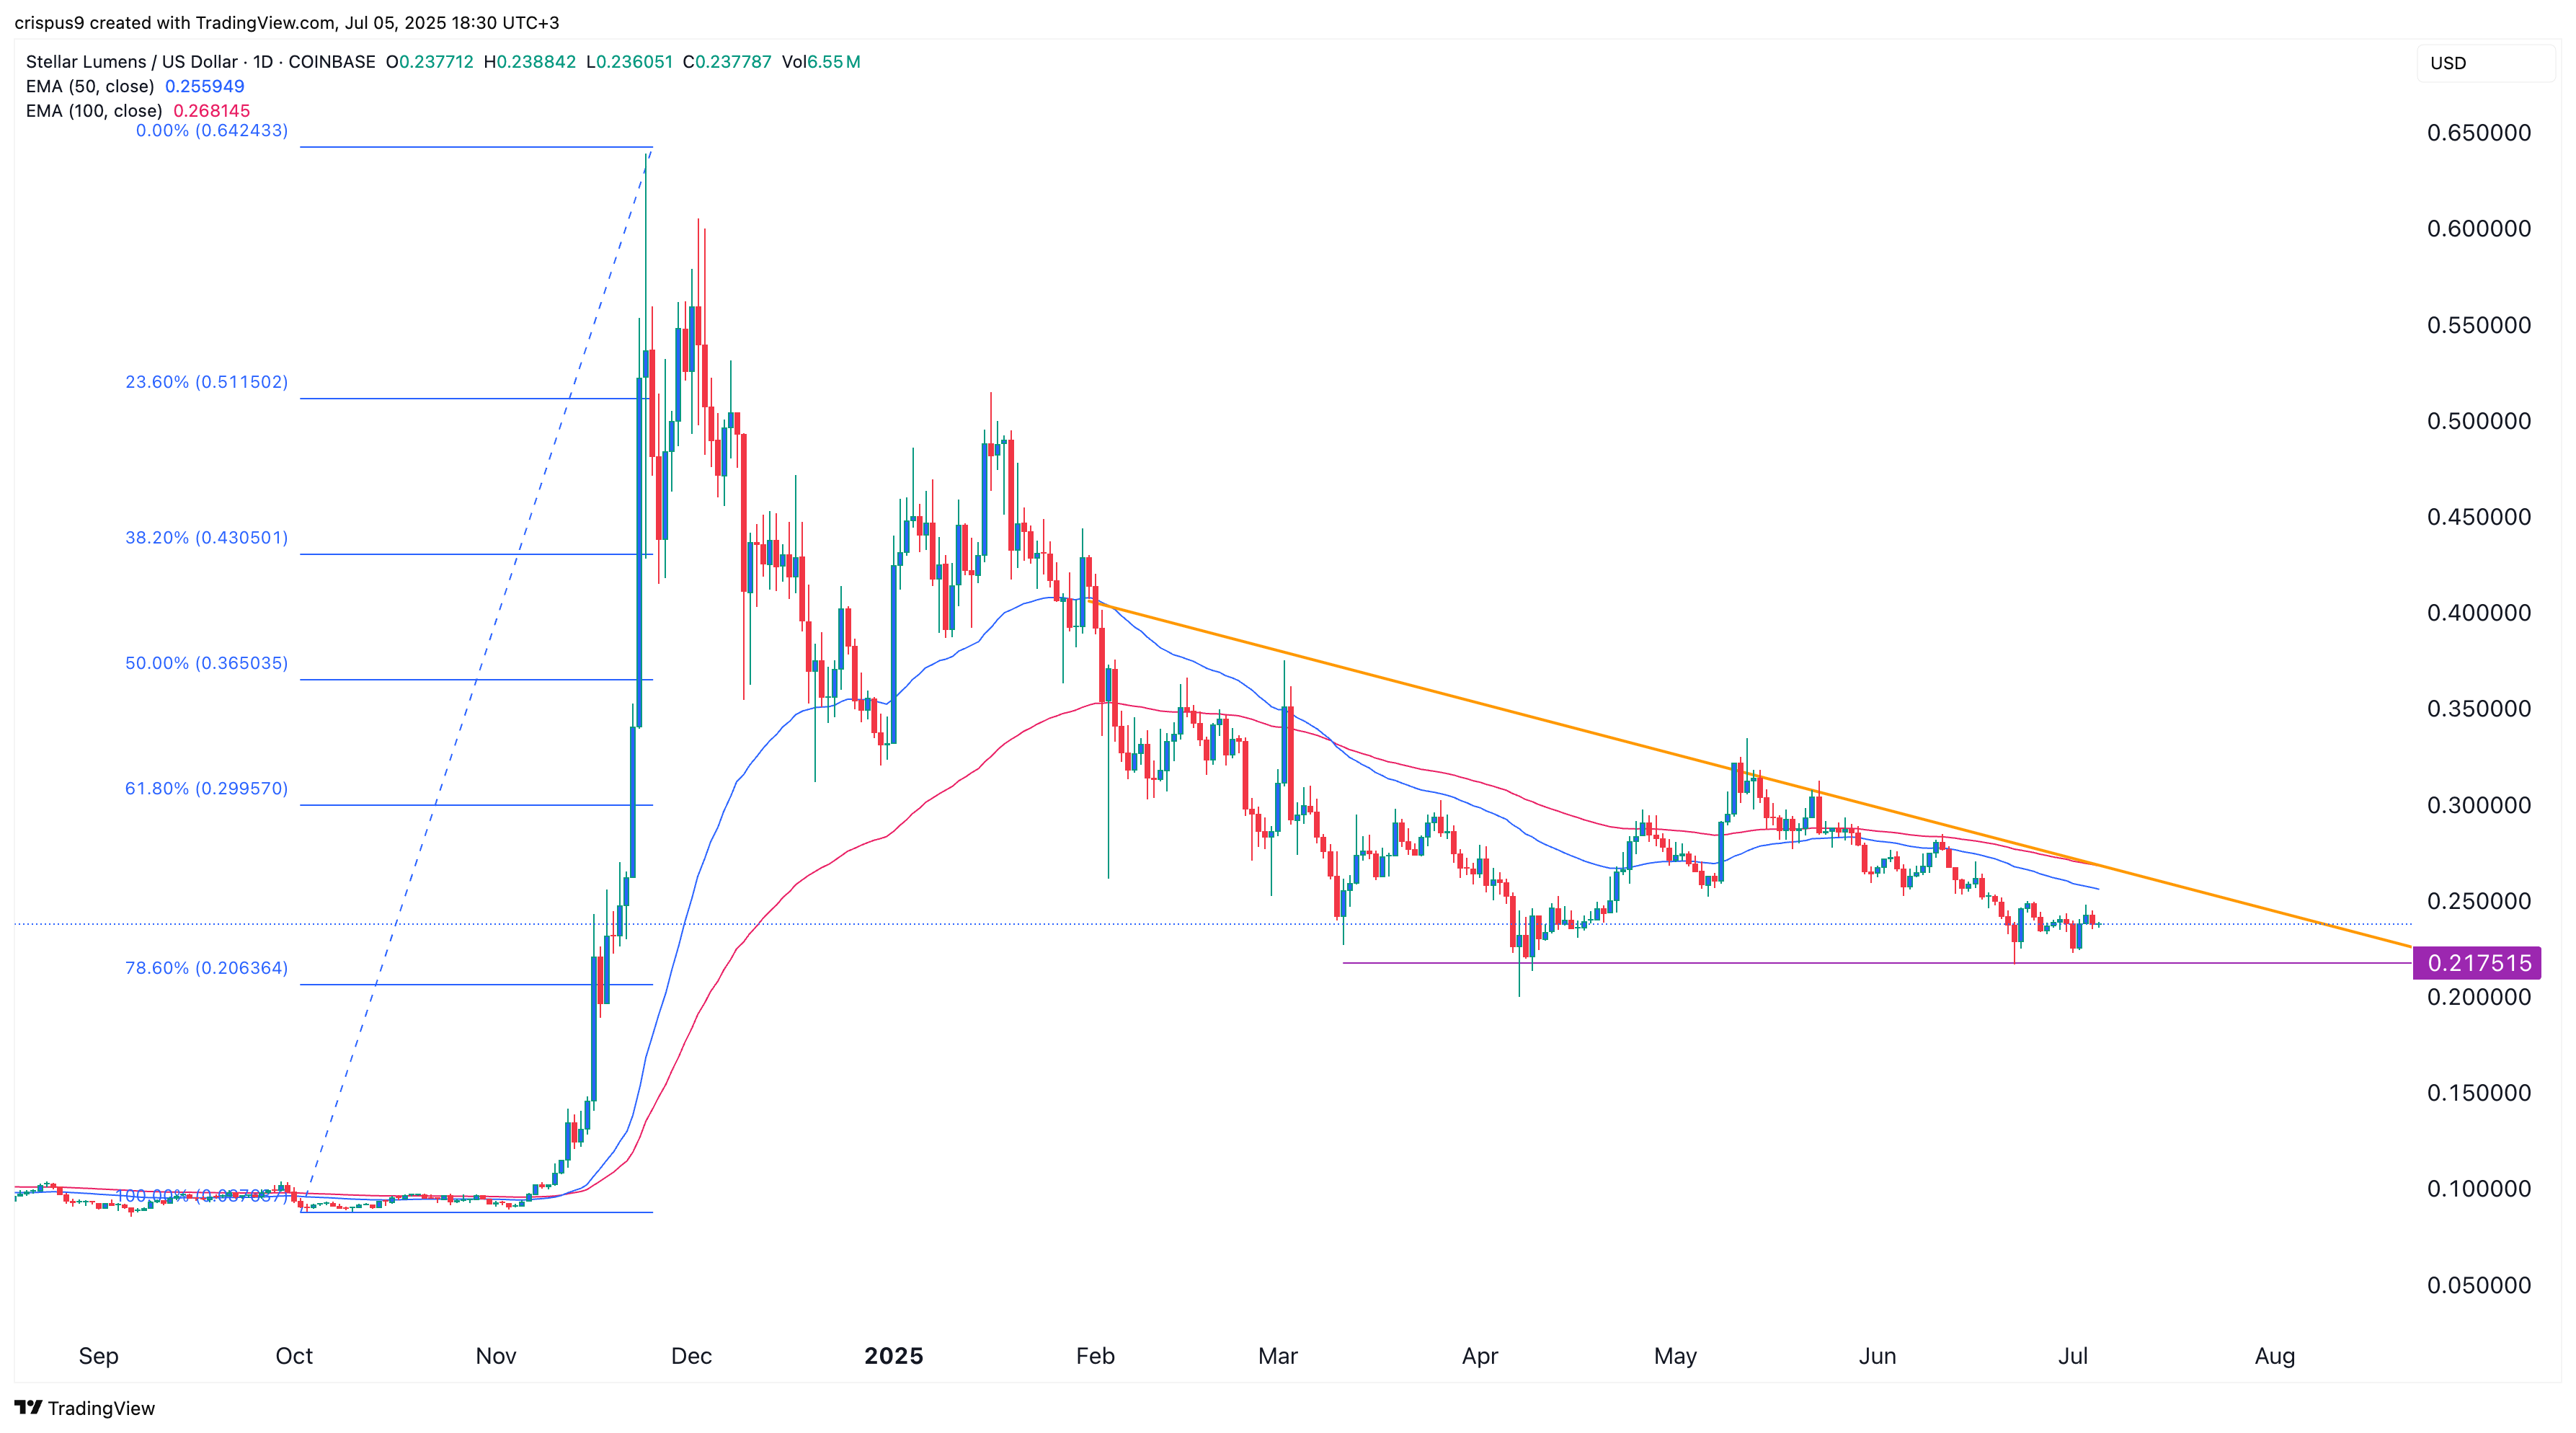
The daily chart shows that the Stellar Lumens token price dropped to a key support level at $0.2175, a notable point that coincided with the lowest point in April, when most altcoins also plummeted.
The support level was the lower side of the descending triangle pattern, a popular bearish continuation pattern. It has moved below the 61.8% Fibonacci Retracement level, where most rebounds happen.
XLM price has dropped below the 50-day and 100-day Exponential Moving Averages. Therefore, a move below the lower side of the triangle will indicate further downside, with the next key level to watch being at $0.15, which is 36% below the current level.


You May Also Like

Trump’s Truth Social Withdraws Bitcoin ETF Filing With the SEC

BTC Maximum AI Avis: Is It a Scam? The Truth (2026)


