

PEPE (PEPE) Price Prediction 2026–2030: Can PEPE Sustain Its Breakout Rally?
- PEPE breakout ignites bullish momentum as volatility expands across meme sector.
- Overbought indicators hint consolidation before PEPE’s next potential upside extension.
- Long-term projections suggest sustained growth if breakout support continues holding.
PEPE has entered 2026 with a powerful bullish breakout, surging above key resistance levels and triggering a sharp expansion in volatility. The token is currently trading near $0.0000071 after posting one of its strongest daily gains in recent months. This move has pushed price above the upper Bollinger Band, while momentum indicators confirm aggressive buyer participation. Although short-term conditions appear stretched, the broader technical picture suggests that PEPE may be entering a new expansion phase if support levels continue to hold.
The rally has reignited speculative interest in the meme coin sector, positioning PEPE as one of the more technically constructive assets in early 2026. However, sustainability will depend on whether buyers can defend newly formed support during periods of consolidation.
Also Read: Pudgy Penguins (PENGU) Price Prediction 2025–2029: Can PENGU Reclaim $0.02 Soon?
Market Sentiment and Momentum
Market sentiment around PEPE has shifted decisively bullish as buyers dominate daily price action. The strength and size of the breakout candle suggest accumulation rather than a short-lived spike, supported by expanding volatility and rising participation.
Despite this optimism, meme assets remain vulnerable to sharp retracements following rapid upside moves. Traders are therefore closely monitoring momentum behavior to determine whether PEPE can transition from breakout conditions into a sustained trend rather than experiencing a volatility-driven pullback.
Current Market Overview
At the time of analysis, PEPE is trading around $0.0000071 , posting a strong double-digit daily increase. Price has reclaimed and moved decisively above the 20-day simple moving average, confirming a shift in short-term trend structure from neutral to bullish.
Price action has also extended beyond the upper Bollinger Band, signaling strong upside momentum. While this confirms buyer control, sustained trading above the band often leads to short-term consolidation. A controlled pullback or sideways movement above breakout levels would reinforce the bullish case moving forward.
Technical Analysis
Bollinger Bands
The Bollinger Bands on the daily chart show sharp upward expansion, highlighting a volatility-driven breakout. Price is currently trading above the upper band, while the 20-day moving average sits significantly lower, emphasizing the speed of the recent move.
This structure suggests strong bullish conviction but also indicates that price may be temporarily overstretched. A period of consolidation above the former upper band near $0.0000062 would be a healthy technical development and would help establish this level as a new support zone.
RSI Behavior
The Relative Strength Index has surged to approximately 82, placing PEPE firmly in overbought territory. This reading reflects intense buying pressure rather than immediate reversal risk. In strong trending environments, RSI can remain elevated for extended periods without triggering major pullbacks.
A gradual RSI cooldown that holds above the 60–65 range would indicate sustained bullish momentum. However, a sharp decline below 55 would signal weakening buyer control and increase the risk of a deeper correction.
Support and Resistance Levels
Immediate support for PEPE is located near $0.0000062, which aligns with the breakout zone and the former upper Bollinger Band. As long as price holds above this area, the bullish structure remains intact. A deeper support level exists near $0.0000044, corresponding with the 20-day moving average and serving as a critical trend-defining zone.
On the upside, initial resistance is emerging around $0.0000075, followed by a broader resistance zone between $0.0000085 and $0.0000090. A sustained move above these levels would confirm continuation of the current rally.
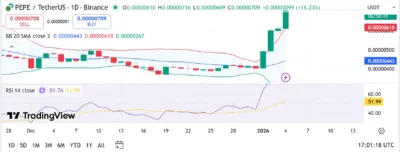
Source: Tradingview
| Year | Minimum Price | Average Price | Maximum Price |
|---|---|---|---|
| 2026 | $0.0000055 | $0.0000080 | $0.0000120 |
| 2027 | $0.0000075 | $0.0000115 | $0.0000165 |
| 2028 | $0.0000105 | $0.0000165 | $0.0000240 |
| 2029 | $0.0000150 | $0.0000245 | $0.0000340 |
| 2030 | $0.0000210 | $0.0000340 | $0.0000480 |
PEPE (PEPE) Price Predictions (2026–2030)
2026
In 2026, PEPE is expected to remain highly volatile as speculative capital continues to rotate through meme assets. If the current breakout structure holds, PEPE could stabilize at higher valuation levels compared to late 2025, with consolidation phases followed by momentum-driven expansions. Maintaining support above $0.0000062 will be critical for sustaining bullish momentum throughout the year.
2027
By 2027, broader crypto market conditions could play a larger role in PEPE’s price behavior. If overall market sentiment improves and liquidity conditions strengthen, PEPE may enter a more defined uptrend characterized by higher highs and higher lows. Increased participation from long-term holders could help reduce downside volatility during corrective phases.
2028
In 2028, PEPE could benefit from maturing liquidity and recurring speculative cycles common in the meme coin sector. Price action during this period may show wider trading ranges, but with a higher average valuation supported by sustained community engagement and periodic market-wide rallies.
2029
As the market progresses into 2029, PEPE may establish itself as a persistent meme asset with deep liquidity and strong brand recognition. If adoption and trading activity remain robust, price could stabilize at significantly higher levels, with pullbacks increasingly viewed as accumulation opportunities rather than trend reversals.
2030
Looking ahead to 2030, PEPE’s long-term outlook will depend heavily on broader crypto adoption and the persistence of speculative interest. Under favorable market conditions, PEPE could experience another expansion phase, supported by renewed retail participation and sustained trading volume.
Conclusion
PEPE enters 2026 in a strong technical position following a decisive breakout above key resistance levels. While overbought momentum conditions suggest short-term volatility and consolidation are likely, the broader trend remains bullish as long as price holds above critical support zones.
If PEPE successfully transitions from breakout to consolidation without losing structure, the rally could extend further. Over the long term, sustained liquidity, strong community participation, and favorable market cycles position PEPE for continued speculative growth through 2030.
FAQs
1. What is the current market sentiment for PEPE in 2026?
Market sentiment is strongly bullish, with price breaking above key resistance levels and momentum indicators confirming buyer dominance.
2. Is PEPE currently overbought?
Yes, RSI readings above 80 indicate overbought conditions, though this can persist during strong trend expansions.
3. Can PEPE continue its rally in 2026?
PEPE can continue higher if it consolidates above the $0.0000062 support level without a sharp breakdown.
4. What are the key levels to watch?
Critical support lies at $0.0000062 and $0.0000044, while resistance is located near $0.0000075 and $0.0000090.
5. What is the long-term outlook for PEPE?
If market conditions remain favorable, PEPE could continue trending higher over the long term, supported by speculative cycles and sustained liquidity.
Also Read: BONK (BONK) Price Prediction 2026–2030: Can BONK Sustain Its Breakout Rally?
The post PEPE (PEPE) Price Prediction 2026–2030: Can PEPE Sustain Its Breakout Rally? appeared first on 36Crypto.


You May Also Like

LTC Technical Analysis Apr 4

Tom Lee and BitMine’s Latest Ethereum Purchase Faces Community Backlash


