Is RENDER Ready for Further Gains After Reclaiming the $2 Price Level?
- RENDER has moved back above $2, showing signs of short-term momentum.
- The price needs to stay above $2 to continue its recovery and avoid a pullback.
Following the continued downside, Render (RENDER) token has resumed interest in the market, with the price now trading around $2.08, a 17% jump in the past 24 hours, according to data from CMC. During the session, RENDER recorded an intraday low of $1.76 and a high of $2.14. This reflects notable upside in recent trading sessions, with a 24-hour trading volume rising above $140 million and a market cap of $1.06 billion, indicating increased activity compared to prior days.
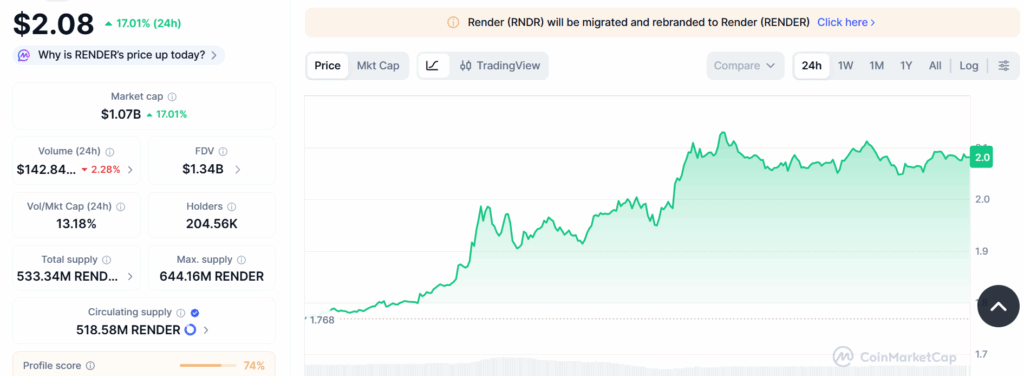 (Source: CMC)
Over the past week, RENDER has gained strength, reporting around 60% weekly price gain, which suggests a return of buyer interest after a period of sideways movement.
Analysts tracking RENDER note that activity around AI-focused infrastructure tokens is heating up, contributing to renewed demand for projects like Render that power decentralized GPU compute and AI workloads. This sector pickup has helped RENDER outperform many broader market peers in recent days.
If market sentiment and adoption continue to improve amid the broader market recovery phase in the new year, RENDER could see gradual rise through 2026, with a possible range between $4.41 and $8.8, levels last seen in early 2025.
RENDER Breaks Out After Period of Sideways Trading
On the short-term chart, RENDER appears to be breaking out from a descending consolidation pattern that had been forming since November. It’s now trading above its short-term simple moving averages, showing some improvement in trend strength. The price has moved past the 20-day ($1.40) and 50-day ($1.58) SMA, which are starting to turn upward. However, the longer-term MAs are still above the current price, meaning that while short-term momentum is improving, the overall trend is still in the early stages of recovery.
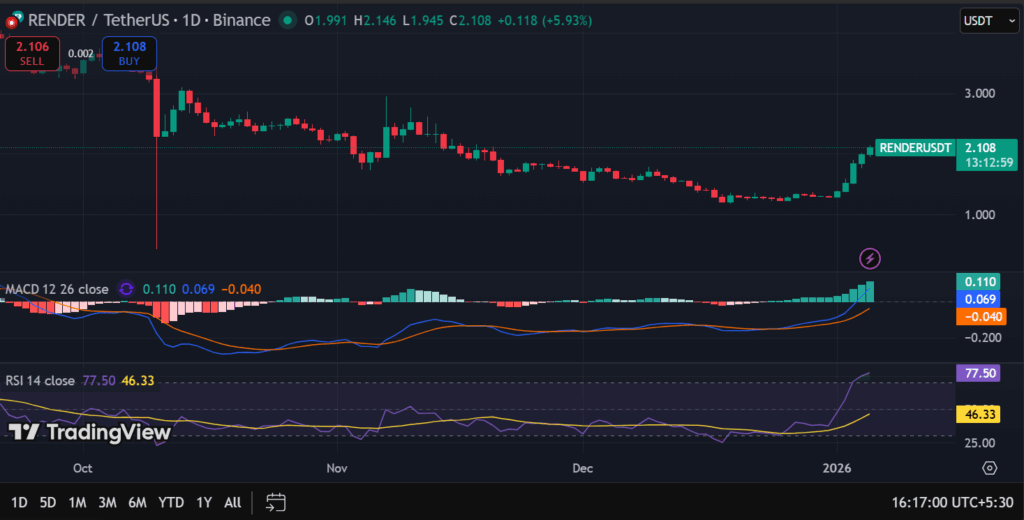 (Source: TradingView)
Zooming in, the RSI on the daily chart has surged to around 77, reflecting strong buying pressure. While this confirms bullish momentum, it also places RENDER in an overbought zone. That means short-term pullbacks or consolidation cannot be ruled out. Historically, such RSI levels often lead to brief pauses rather than immediate reversals, especially when volume remains elevated.
Meanwhile, the MACD indicator supports the bullish outlook. The MACD line has crossed above the signal line, and the histogram has turned positive and continues to expand. This setup indicates that upward momentum is building and that buyers currently dominate market structure, even if minor pullbacks occur.
Looking ahead, immediate resistance lies near the $2.20 area, where previous selling pressure was observed. A clean move above this level could strengthen bullish structure and open the door toward the $2.40–$2.50 range in the near term. On the downside, the former resistance near $2.00 now acts as the first support. A deeper pullback could test the $1.85 and $1.70 levels, which remains a crucial zone for maintaining the current recovery trend.
Overall, RENDER’s recent price movement shows that sentiment is improving after a long period of weakness. Even though the price may cool off in the short term. The chart suggests it is trying to settle above important support levels.
Highlighted Crypto News Today:
Virtuals Protocol Price Jumps 22% in 24 Hours, Reclaims $1 Level


You May Also Like

Mubadala raises its Bitcoin ETF stake 16% to $566 million

From Telegram to Terminal: Banana Gun’s Pro Platform Hits Ethereum as User Base Surpasses One Million