With a 2.02% plunge, the global crypto market opened a new trading day, and the majority of the digital assets have charted in red. The broader market sentimentWith a 2.02% plunge, the global crypto market opened a new trading day, and the majority of the digital assets have charted in red. The broader market sentiment

Downward Drift in SUI: Could Former Lows Make a Comeback?

  • SUI is currently hovering near the $1.80 mark.
  • Its 24-hour trading volume has dropped by 32%.

With a 2.02% plunge, the global crypto market opened a new trading day, and the majority of the digital assets have charted in red. The broader market sentiment is neutral, as the Fear and Greed Index value holds at 43. As the bears are in control, the popular assets like BTC and ETH are currently hovering on the downside. 

Meanwhile, SUI has registered a loss of 3.91% in value over the last 24 hours. In the early hours, the asset traded at a high range of $1.96, and with the bearish encounter in the market, the price has fallen to a low level of $1.79. If the bears gained more traction, the price would see intensified losses. 

According to the CoinMarketCap data, the active bears have pulled the SUI price back, trading at the $1.80 zone, with its market cap settled at $6.79 billion. In addition, the daily trading volume of the asset has dropped by 32.87%, likely reaching the $1.07 billion mark. 

Technical Chart Points to Growing Downside Pressure on SUI

On the 4-hour chart, the SUI/USDT pair shows a bearish trading pattern, which might signal a continuous downtrend. Several red candles have formed, and the price could slip to the $1.70 support range. Further loss will trigger the emergence of the death cross. On the other hand, unless SUI convincingly climbs and breaks the $1.90 resistance and eventually goes above the $2 mark, the broader downtrend could continue. 

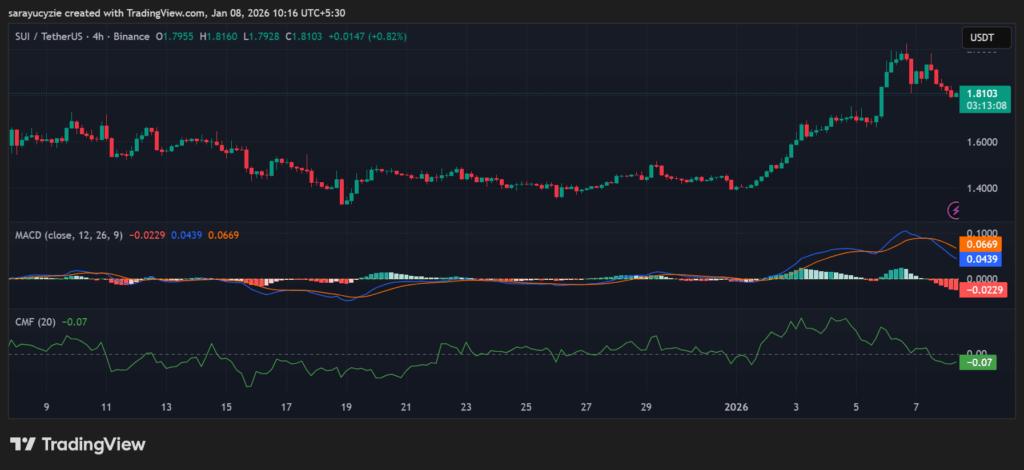
SUI chart (Source: TradingView)

SUI’s MACD line is below the signal line, suggesting a bearish outlook. The current price strength is weaker than the longer-term trend, and this is a sign to stay cautious, as the gap between the lines is widening. Besides, the CMF value is slightly negative, at -0.07, indicating a mild capital outflow from the asset. The move is not strong enough for an aggressive distribution, reflecting weak momentum, rather than a clear downtrend. 

Moreover, the daily RSI of 51.49 shows that the asset is in a neutral zone, neither bulls nor bears in clear control. Notably, this level brings in consolidation or a pause in price action. SUI’s BBP reading of -0.0747 is close to zero, which implies slight bearish dominance in the market. The momentum is weak rather than strongly bearish. It aligns with sideways or consolidation phases, where price direction is not established yet.

Top Updated Crypto News

US Senate Committees Set Markup on Crypto Market Structure Bill

Market Opportunity
Drift Protocol Logo
Drift Protocol Price(DRIFT)
$0.1599
$0.1599$0.1599
-2.38%
USD
Drift Protocol (DRIFT) Live Price Chart
Disclaimer: The articles reposted on this site are sourced from public platforms and are provided for informational purposes only. They do not necessarily reflect the views of MEXC. All rights remain with the original authors. If you believe any content infringes on third-party rights, please contact service@support.mexc.com for removal. MEXC makes no guarantees regarding the accuracy, completeness, or timeliness of the content and is not responsible for any actions taken based on the information provided. The content does not constitute financial, legal, or other professional advice, nor should it be considered a recommendation or endorsement by MEXC.

You May Also Like

FBI says North Korea’s Kimsuky APT uses malicious QR codes to spearphish U.S. entities

FBI says North Korea’s Kimsuky APT uses malicious QR codes to spearphish U.S. entities

The post FBI says North Korea’s Kimsuky APT uses malicious QR codes to spearphish U.S. entities appeared on BitcoinEthereumNews.com. The FBI says Kimsuky APT, a
Share
BitcoinEthereumNews2026/01/10 02:55
Crypto ETFs Close Week Strong Despite Broad Outflows in Ether Funds

Crypto ETFs Close Week Strong Despite Broad Outflows in Ether Funds

Bitcoin ETFs finished the week with $223 million in net inflows, while Ether ETFs held positive at $48 million despite heavy redemptions across multiple funds. Blackrock’s vehicles once again carried the momentum for both markets. Bitcoin and Ether ETFs End the Week in Green With $271 Million in Combined Inflows The week ended with a […]
Share
Coinstats2025/09/22 23:20
Whales Dump 200 Million XRP in Just 2 Weeks – Is XRP’s Price on the Verge of Collapse?

Whales Dump 200 Million XRP in Just 2 Weeks – Is XRP’s Price on the Verge of Collapse?

Whales offload 200 million XRP leaving market uncertainty behind. XRP faces potential collapse as whales drive major price shifts. Is XRP’s future in danger after massive sell-off by whales? XRP’s price has been under intense pressure recently as whales reportedly offloaded a staggering 200 million XRP over the past two weeks. This massive sell-off has raised alarms across the cryptocurrency community, as many wonder if the market is on the brink of collapse or just undergoing a temporary correction. According to crypto analyst Ali (@ali_charts), this surge in whale activity correlates directly with the price fluctuations seen in the past few weeks. XRP experienced a sharp spike in late July and early August, but the price quickly reversed as whales began to sell their holdings in large quantities. The increased volume during this period highlights the intensity of the sell-off, leaving many traders to question the future of XRP’s value. Whales have offloaded around 200 million $XRP in the last two weeks! pic.twitter.com/MiSQPpDwZM — Ali (@ali_charts) September 17, 2025 Also Read: Shiba Inu’s Price Is at a Tipping Point: Will It Break or Crash Soon? Can XRP Recover or Is a Bigger Decline Ahead? As the market absorbs the effects of the whale offload, technical indicators suggest that XRP may be facing a period of consolidation. The Relative Strength Index (RSI), currently sitting at 53.05, signals a neutral market stance, indicating that XRP could move in either direction. This leaves traders uncertain whether the XRP will break above its current resistance levels or continue to fall as more whales sell off their holdings. Source: Tradingview Additionally, the Bollinger Bands, suggest that XRP is nearing the upper limits of its range. This often points to a potential slowdown or pullback in price, further raising concerns about the future direction of the XRP. With the price currently around $3.02, many are questioning whether XRP can regain its footing or if it will continue to decline. The Aftermath of Whale Activity: Is XRP’s Future in Danger? Despite the large sell-off, XRP is not yet showing signs of total collapse. However, the market remains fragile, and the price is likely to remain volatile in the coming days. With whales continuing to influence price movements, many investors are watching closely to see if this trend will reverse or intensify. The coming weeks will be critical for determining whether XRP can stabilize or face further declines. The combination of whale offloading and technical indicators suggest that XRP’s price is at a crossroads. Traders and investors alike are waiting for clear signals to determine if the XRP will bounce back or continue its downward trajectory. Also Read: Metaplanet’s Bold Move: $15M U.S. Subsidiary to Supercharge Bitcoin Strategy The post Whales Dump 200 Million XRP in Just 2 Weeks – Is XRP’s Price on the Verge of Collapse? appeared first on 36Crypto.
Share
Coinstats2025/09/17 23:42