

Dogecoin Breaks Its ‘Lower-Band Prison’ As Daily Trend Flips

The Dogecoin price is currently up by approximately 17% since the December 31 low and the rebound is starting to look less like a dead-cat bounce and more like a regime change, according to crypto analyst Cantonese Cat, who points to a clear shift in how DOGE is trading inside its Bollinger Bands on the daily chart.
The setup matters now because price has moved from months of lower-band pressure into the upper half of the range, often the earliest tell that trend behavior is rotating.
Cantonese Cat’s latest daily view (Binance) frames the move through Bollinger Band positioning rather than pattern-chasing. As the analyst put it: “DOGE daily shows a clear trend change that is easy to see when you see how it was riding on the lower half of the Bollinger band for months but now has a clear change in character.”
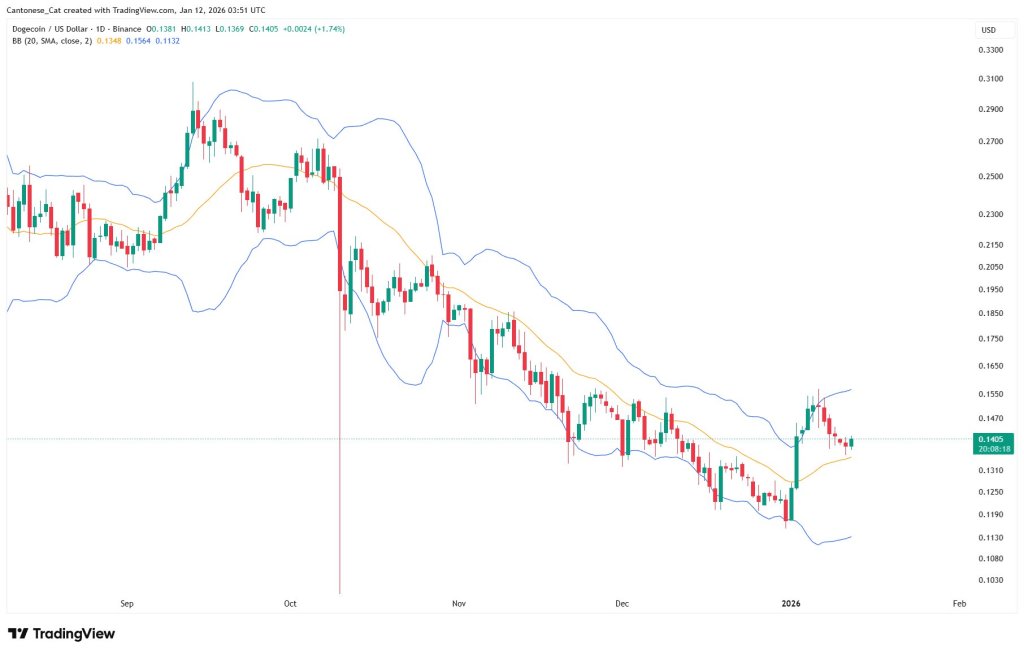
That “character” is visible in the band mechanics. DOGE closed around $0.1405 on the print shown, now trading above the 20-day basis line near $0.1348 after spending much of the prior stretch leaning into the lower half of the envelope. The upper band is near $0.1564 and the lower band near $0.1132.
In the analyst’s framing, the basis line becomes the near-term “line in the sand” for whether this is a genuine trend flip or simply a volatility expansion that fades. Holding above it keeps price in the upper half of the bands, where trends typically behave differently than they do during lower-band rides.
Weekly And Monthly Chart Support The Thesis
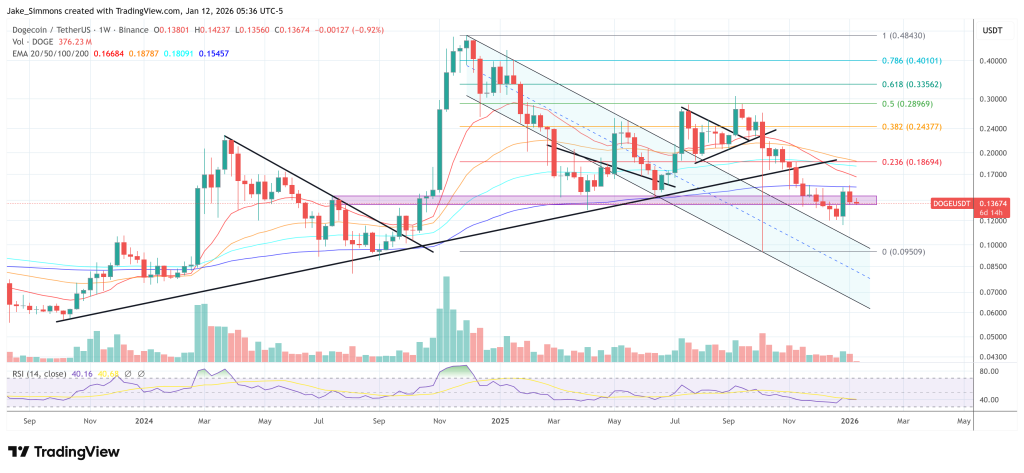
Zooming out, Cantonese Cat’s weekly chart (Dec. 20) casts the broader structure as an Elliott-style sequence: a completed Wave 1 advance followed by a Wave 2 correction. The analyst wrote: “We’ve already had a 13 month bear market for DOGE, with my working hypothesis of this being likely a wave 2 correction prior to wave 3 explosion. The entire reason why this may play out is that it doesn’t feel likely right now, and you want me to stop posting.”
The levels on the chart are explicit. DOGE is sitting between the 0.382 retracement near $0.1177 and the 0.5 level near $0.1542, with higher retracement markers at roughly $0.2021 (0.618), $0.2477 (0.707), $0.2968 (0.786), and $0.3732 (0.886).

Above that, the 1.0 level is labeled near $0.4844, with extensions reaching approximately $0.9029 (1.272), $1.2497 (1.414), $1.9934 (1.618), $4.7793 (2.0), and $8.9077 (2.272), the latter aligning with the analyst’s repeatedly cited “$9 region” target for this cycle.
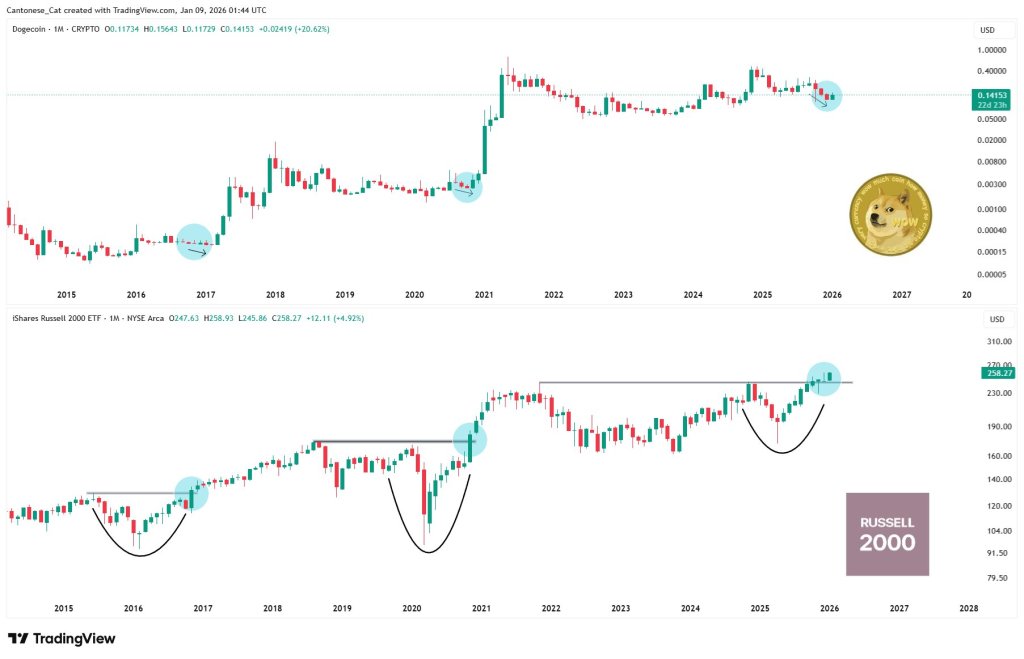
On Jan. 9, Cantonese Cat paired DOGE’s monthly chart with the iShares Russell 2000 ETF (IWM), arguing a recurring bull-phase rhythm: “DOGE has always been about 2-4 months behind IWM during the bull phase.” The comparison highlights prior instances where IWM’s breakout behavior preceded DOGE’s major upside phases, implying DOGE’s current improvement could be read as a delayed echo if the template holds.
Overall, the near-term question is whether DOGE can keep closing above the daily Bollinger basis (~$0.1348) and avoid slipping back into the lower-half posture that defined the prior months. On the upside, a break above the upper band region (~$0.1564) and the 0.5 Fib ($0.1542) is crucial for further upside.
At press time, DOGE traded at $0.13674.


You May Also Like

CBS News eyes podcasting legend for Anderson Cooper’s '60 Minutes' replacement

Trump insider unleashes vulgar on-air tirade against John Thune on Steve Bannon's podcast

Ripple Price Outlook: Can XRP Reclaim $2.5 by 2027?


