The post Sell Pressure Fades as Bitcoin Price Consolidates Above $91,000—Is $100K Next? appeared first on Coinpedia Fintech News Bitcoin price is holding steadyThe post Sell Pressure Fades as Bitcoin Price Consolidates Above $91,000—Is $100K Next? appeared first on Coinpedia Fintech News Bitcoin price is holding steady

Sell Pressure Fades as Bitcoin Price Consolidates Above $91,000—Is $100K Next?

Bitcoin Bottom Confirmed Bernstein and Coinbase Analyst Agree on Bullish Outlook

The post Sell Pressure Fades as Bitcoin Price Consolidates Above $91,000—Is $100K Next? appeared first on Coinpedia Fintech News

Bitcoin price is holding steady after a brief rebound, but the market still lacks a decisive trigger. BTC is consolidating above $91,000, while traders keep a close watch on whether the range turns into a breakout or another rejection. Volatility remains compressed, suggesting a larger move could be building as liquidity clusters around key levels. With risk sentiment turning highly reactive and positioning tightening, the big question is whether Bitcoin can build enough momentum to retest the $100,000 zone in the near term.

Sell-side Risk Ratio Cools as Holders Slow Down Profit-Taking

The next clue comes from Glassnode’s Sell-side Risk Ratio, which tracks how much profit or loss investors are realising relative to Bitcoin’s market cap. In simple terms, it shows whether the market is seeing heavy distribution (aggressive selling into strength) or lighter selling (holders choosing to sit tight).

bitcoin price

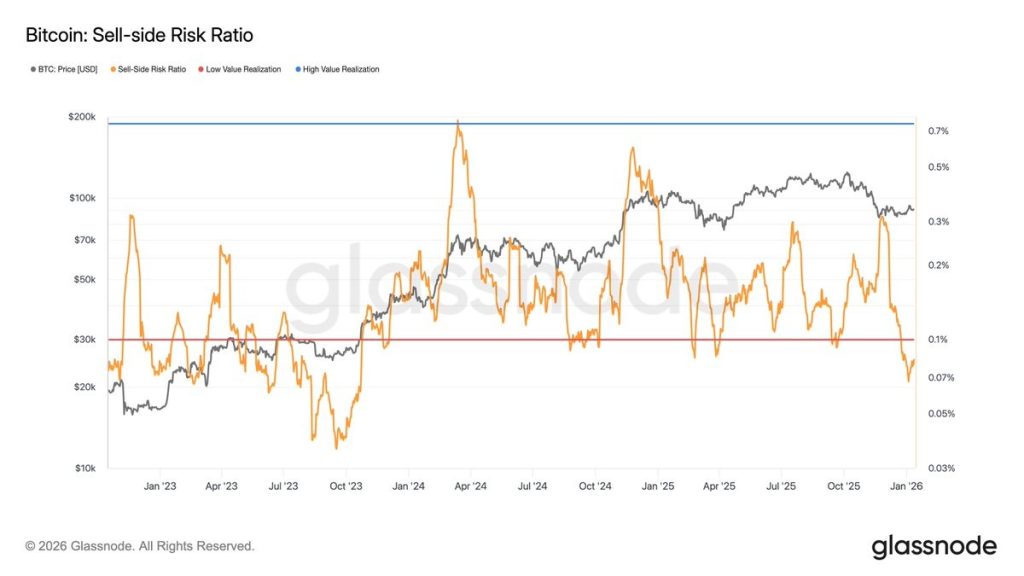
On the chart, the Sell-side Risk Ratio has dropped toward the lower band after spending much of 2024–2025 oscillating at higher levels. Historically, the bigger spikes in this metric have aligned with periods of strong profit realization and overheated moves, while dips toward the lower zone have appeared during cool-down phases where sell pressure eases and the market builds a base.

This supports a constructive consolidation thesis: if holders aren’t rushing to realize profits, BTC often needs a fresh demand catalyst to push higher—but it also reduces the odds of an immediate, seller-driven collapse. The risk is that low selling pressure can still mean low urgency from buyers, which keeps BTC choppy until the price breaks key resistance with volume.

Will Bitcoin Price Reach $100K This Month?

The Bitcoin price has been closely consolidating within a tight range for the past weeks following a recovery from the interim lows around $80,000. The price is struggling to clear the resistance zone between $91,600 and $93,500 as it is facing constant bearish pressure. Despite this, the volume remains within the average, suggesting considerable trader participation, regardless of the sluggish behavior of the BTC price.  

bitcoin price

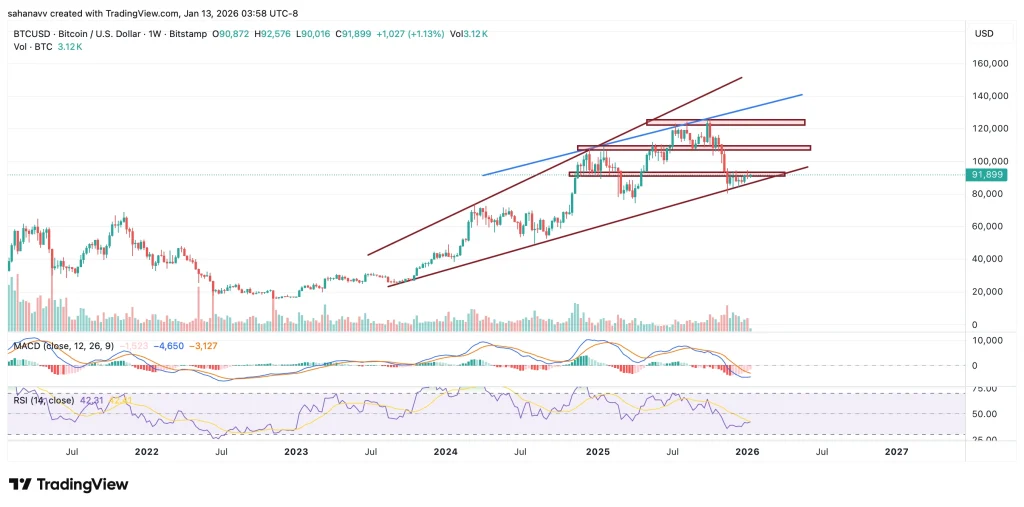
The weekly price action of BTC reflects the growing momentum of bulls as the rally continues to trade along the rising trend line. This line has been acting as a strong support since 2024, and a rebound from this zone suggests the upcoming rally could be more explosive than before. The weekly MACD is preparing for a bullish crossover, and the weekly RSI has just begun to rise. This indicates there is more room for the bulls to thrive, and hence the upper target for the Bitcoin (BTC) price rally is much ahead than $100,000.

Is Bitcoin (BTC) Price Heading Towards a New ATH?

As seen in the above chart, the price is consolidating within the rising expanding channel and has rebounded from the support. In the previous rebounds, the price has surged towards the resistance. Therefore, the Bitcoin price is believed to rise, but to mark a new ATH, the token is required to clear 2 important resistance zones. After the current one, it needs to surge above the price range between $106,800 and $109,600. A rise above this range may push the levels above $110,000 and later the ATH price levels. 

Market Opportunity
Bitcoin Logo
Bitcoin Price(BTC)
$92,897.45
$92,897.45$92,897.45
+1.34%
USD
Bitcoin (BTC) Live Price Chart
Disclaimer: The articles reposted on this site are sourced from public platforms and are provided for informational purposes only. They do not necessarily reflect the views of MEXC. All rights remain with the original authors. If you believe any content infringes on third-party rights, please contact service@support.mexc.com for removal. MEXC makes no guarantees regarding the accuracy, completeness, or timeliness of the content and is not responsible for any actions taken based on the information provided. The content does not constitute financial, legal, or other professional advice, nor should it be considered a recommendation or endorsement by MEXC.

You May Also Like

Franklin Templeton CEO Dismisses 50bps Rate Cut Ahead FOMC

Franklin Templeton CEO Dismisses 50bps Rate Cut Ahead FOMC

The post Franklin Templeton CEO Dismisses 50bps Rate Cut Ahead FOMC appeared on BitcoinEthereumNews.com. Franklin Templeton CEO Jenny Johnson has weighed in on whether the Federal Reserve should make a 25 basis points (bps) Fed rate cut or 50 bps cut. This comes ahead of the Fed decision today at today’s FOMC meeting, with the market pricing in a 25 bps cut. Bitcoin and the broader crypto market are currently trading flat ahead of the rate cut decision. Franklin Templeton CEO Weighs In On Potential FOMC Decision In a CNBC interview, Jenny Johnson said that she expects the Fed to make a 25 bps cut today instead of a 50 bps cut. She acknowledged the jobs data, which suggested that the labor market is weakening. However, she noted that this data is backward-looking, indicating that it doesn’t show the current state of the economy. She alluded to the wage growth, which she remarked is an indication of a robust labor market. She added that retail sales are up and that consumers are still spending, despite inflation being sticky at 3%, which makes a case for why the FOMC should opt against a 50-basis-point Fed rate cut. In line with this, the Franklin Templeton CEO said that she would go with a 25 bps rate cut if she were Jerome Powell. She remarked that the Fed still has the October and December FOMC meetings to make further cuts if the incoming data warrants it. Johnson also asserted that the data show a robust economy. However, she noted that there can’t be an argument for no Fed rate cut since Powell already signaled at Jackson Hole that they were likely to lower interest rates at this meeting due to concerns over a weakening labor market. Notably, her comment comes as experts argue for both sides on why the Fed should make a 25 bps cut or…
Share
BitcoinEthereumNews2025/09/18 00:36
Why Is Crypto Up Today? – January 13, 2026

Why Is Crypto Up Today? – January 13, 2026

The crypto market is trading slightly higher today, with total cryptocurrency market capitalization rising by around 1.7% over the past 24 hours to approximately
Share
CryptoNews2026/01/13 22:26
BTC Leverage Builds Near $120K, Big Test Ahead

BTC Leverage Builds Near $120K, Big Test Ahead

The post BTC Leverage Builds Near $120K, Big Test Ahead appeared on BitcoinEthereumNews.com. Key Insights: Heavy leverage builds at $118K–$120K, turning the zone into Bitcoin’s next critical resistance test. Rejection from point of interest with delta divergences suggests cooling momentum after the recent FOMC-driven spike. Support levels at $114K–$115K may attract buyers if BTC fails to break above $120K. BTC Leverage Builds Near $120K, Big Test Ahead Bitcoin was trading around $117,099, with daily volume close to $59.1 billion. The price has seen a marginal 0.01% gain over the past 24 hours and a 2% rise in the past week. Data shared by Killa points to heavy leverage building between $118,000 and $120,000. Heatmap charts back this up, showing dense liquidity bands in that zone. Such clusters of orders often act as magnets for price action, as markets tend to move where liquidity is stacked. Price Action Around the POI Analysis from JoelXBT highlights how Bitcoin tapped into a key point of interest (POI) during the recent FOMC-driven spike. This move coincided with what was called the “zone of max delta pain”, a level where aggressive volume left imbalances in order flow. Source: JoelXBT /X Following the test of this area, BTC faced rejection and began to pull back. Delta indicators revealed extended divergences, with price rising while buyer strength weakened. That mismatch suggests demand failed to keep up with the pace of the rally, leaving room for short-term cooling. Resistance and Support Levels The $118K–$120K range now stands as a major resistance band. A clean move through $120K could force leveraged shorts to cover, potentially driving further upside. On the downside, smaller liquidity clusters are visible near $114K–$115K. If rejection holds at the top, these levels are likely to act as the first supports where buyers may attempt to step in. Market Outlook Bitcoin’s next decisive move will likely form around the…
Share
BitcoinEthereumNews2025/09/18 16:40