Quant Price Prediction 2026–2030: Can QNT Break Above $100 Soon?
- Quant Climbs Near $85 as Buyers Reclaim Key Moving Averages
- Spot inflows confirm accumulation as momentum shifts toward bulls.
- The 200-day EMA now stands as the critical resistance level.
Quant price today trades near $84.98 after posting an 8.35% gain in a single session, marking its strongest daily advance in months. The rally represents the first decisive break above the 100-day EMA since October, shifting short-term momentum back toward buyers as spot flows turn positive.
The move follows months of corrective price action inside a descending channel that has capped upside since the July peak near $135. While the breakout improves near-term structure, price now approaches a major resistance zone where sellers have previously regained control. Buyers have reclaimed multiple technical levels, but confirmation depends on whether follow-through can be sustained above long-term resistance.
Also Read: White Whale (WHALE) Price Prediction 2026–2030: Can WHALE Hit $0.4200 Soon?
Spot Inflows Signal Accumulation
Exchange flow data confirms that the rally has fundamental support. According to Coinglass, QNT recorded $569,380 in net spot inflows on January 17, reversing the distribution trend that dominated Q4 2025. Positive netflows typically indicate accumulation behavior, as tokens move off exchanges and into private wallets. This reduces available supply on order books, supporting price during rallies and limiting downside during pullbacks.
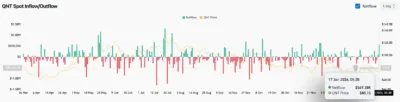
Source: Coinglass
The inflow suggests traders are positioning ahead of potential catalysts rather than selling into strength, reinforcing the credibility of the current breakout attempt.
Enterprise Narrative Strengthens Market Confidence
Quant’s fundamentals remain stronger than most mid-cap altcoins. The project continues to attract attention due to its enterprise partnerships with major UK banks including HSBC, Barclays, and Lloyds, focused on building infrastructure for tokenized sterling deposits.
In Japan, Quant’s collaboration with Dentsu Soken targets institutional stablecoins and programmable settlement systems. These initiatives are powered by Overledger OS, which connects more than 45 blockchains while maintaining ISO 20022 compliance.
With the interoperability market projected to reach $19.59 billion by 2032, Quant’s institutional-first strategy positions it within a defensible niche that continues to attract capital during broader altcoin rallies.
EMA Structure Signals a Shift in Momentum
On the daily chart, Quant has traded inside a descending channel since July, consistently printing lower highs as sellers defended overhead resistance and capped each recovery attempt. That structure began to shift during the latest session as price staged a decisive breakout above multiple moving averages in one move. Quant cleared the 20-day EMA at $76.60, the 50-day EMA at $78.42, and the 100-day EMA at $82.67, signaling a clear improvement in short-term momentum.
The breakout candle showed strong follow-through, reaching an intraday high of $86.65 before consolidating. Immediate resistance now sits near the 200-day EMA at $88.01, while channel resistance lies between $90 and $92. On the downside, $82.67 acts as near-term support, with $76.60 as the key breakdown level. The Supertrend remains bullish above $68.05, favoring buyers.
Bulls Confront the 200-Day EMA
The 200-day EMA near $88.01 represents the most significant technical barrier. This level has acted as resistance since September, rejecting multiple rally attempts in the $88–$90 zone. A daily close above $88 would signal a meaningful trend shift, breaking both the EMA barrier and the upper boundary of the descending channel. Such a move would open the path toward $100, with scope for extension toward $110.
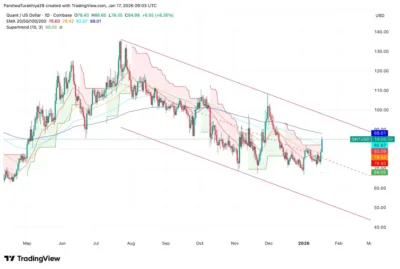
Source: Tradingview
Failure to reclaim the 200-day EMA would keep price contained within the channel. In that scenario, the current breakout may prove to be a relief rally, increasing the likelihood of a pullback to test $82 support. Volume and follow-through over the next several sessions will determine whether buyers can convert this momentum shift into a sustained trend reversal.
Key Support and Resistance Levels for Quant
For the bullish case to remain intact, QNT must hold above $82.67 and secure a daily close above $88.01. Acceptance above this level would confirm trend control and open the door toward $100. On the downside, failure to hold the 100-day EMA would weaken momentum and expose the $76.60 level. A deeper breakdown would bring the Supertrend support at $68.05 back into focus.
A daily close above $88 would confirm bullish continuation. Rejection at resistance would keep the broader structure corrective rather than trend-forming.
Quant Price Prediction 2026–2030
| Year | Minimum Price | Average Price | Maximum Price |
| 2026 | $68 | $85 | $100 |
| 2027 | $75 | $95 | $110 |
| 2028 | $82 | $105 | $120 |
| 2029 | $90 | $115 | $135 |
| 2030 | $100 | $125 | $150 |
2026
Quant enters 2026 attempting to transition out of a prolonged corrective phase. Holding above the 100-day EMA remains critical, while a confirmed reclaim of the 200-day EMA would mark the first meaningful step toward trend reversal.
2027
If enterprise adoption continues and accumulation persists, QNT could trade within a higher range as volatility compresses. Price action during this period is likely to remain selective rather than broadly speculative.
2028
With improving structure and sustained demand, Quant could attempt a more durable recovery phase. Upside progress is likely to occur in measured extensions rather than sharp breakouts.
2029
By 2029, a clearer long-term trend could emerge if QNT continues to defend higher support levels. Sustained acceptance above former resistance would be essential for maintaining upside momentum.
2030
By 2030, long-term structural clarity should be evident. If Quant successfully establishes itself above prior cycle resistance, price action could reflect a more established trend rather than prolonged consolidation.
Conclusion
Quant’s price has reclaimed key moving averages for the first time in months, supported by spot inflows and strong enterprise fundamentals. While momentum has shifted in favor of buyers, the broader trend hinges on whether QNT can clear the 200-day EMA near $88.
Until that level is decisively reclaimed, rallies remain vulnerable to rejection. The coming sessions will determine whether this breakout evolves into a sustained trend reversal or stalls back into consolidation. Quant now sits at a critical decision point.
FAQs
1.Why is Quant price rising now?
Positive spot inflows suggest accumulation, with buyers repositioning rather than selling into strength.
2. What is the key support level for QNT?
The primary near-term support is the 100-day EMA at $82.67.
3. What resistance must QNT break to turn bullish?
A daily close above the 200-day EMA at $88.01 is required to confirm trend reversal.
4. Could QNT fall back to $76?
Yes. A loss of the 100-day EMA would expose the $76.60 support level.
5. Is Quant still in a downtrend?
Structurally, yes. QNT remains inside a descending channel until price breaks and holds above the 200-day EMA and channel resistance.
Also Read: Cosmos Price Prediction 2026–2030: Can ATOM Hit $3.20 Soon?
The post Quant Price Prediction 2026–2030: Can QNT Break Above $100 Soon? appeared first on 36Crypto.


You May Also Like

Moomoo US Receives Regulatory Green Light to Launch Prediction Market

Trump biographer: Epstein joked about his legal troubles while orchestrating defense