Ethereum price hovering below a key breakout zone as a record share of its supply is locked in staking, tightening available liquidity. Ethereum was trading at $Ethereum price hovering below a key breakout zone as a record share of its supply is locked in staking, tightening available liquidity. Ethereum was trading at $

Ethereum price retests breakout zone — can rally follow as staked ETH hits an all-time high of 30%?

3 min read

Ethereum price hovering below a key breakout zone as a record share of its supply is locked in staking, tightening available liquidity.

Summary
  • Ethereum is consolidating below $3,400 as volatility contracts and momentum cools.
  • Staked ETH has reached a record 30% of total supply, reducing circulating liquidity.
  • Derivatives activity has slowed, pointing to caution rather than aggressive positioning.

Ethereum was trading at $3,162 at press time, down 1.3% over the past 24 hours. Over the last week, the price has moved between $3,119 and $3,379. ETH is up about 3.6% over the past month after climbing back above $3,000, though it remains well below its August record high of $4,946.

Trading activity has slowed. Ethereum’s (ETH) 24-hour volume fell roughly 19% to $20 billion, showing fewer traders are active at current levels.

Futures data from CoinGlass points to a similar trend. Derivatives volume dropped more than 22%, while open interest fell 2% to $40.26 billion. This suggests traders are cutting back on leverage rather than positioning for a sharp move.

Staking reaches a new high

While price action has cooled, Ethereum’s staking activity continues to grow. Data shared by Solid Intel on Jan. 20 shows that close to 30% of all ETH in circulation is now staked.

In total, around 36.2 million ETH, worth close to $120 billion at recent prices, is locked into the network. Staking returns have edged lower, now sitting between 2.8% and 4%, as more ETH enters the system.

Even so, the steady inflow suggests many holders are focused on long-term participation rather than short-term price moves.

Queue data supports that view. More than 2.6 million ETH is waiting to be staked, while very little is queued to exit. This imbalance signals strong confidence and little interest in unlocking funds.

Major firms are taking part as well. Companies such as BitMine continuing to expand their staking holdings suggest that institutional investors see staking as a core strategy. While some analysts have raised concerns about centralization, the overall outlook on staking remains positive.

Ethereum price technical analysis

Ethereum is trading just under the $3,350–$3,400 zone, an area that has repeatedly capped recent gains. Price movement has narrowed, pointing to consolidation rather than a clear trend.

Ethereum price retests breakout zone — can rally follow as staked ETH hits an all-time high of 30%? - 1

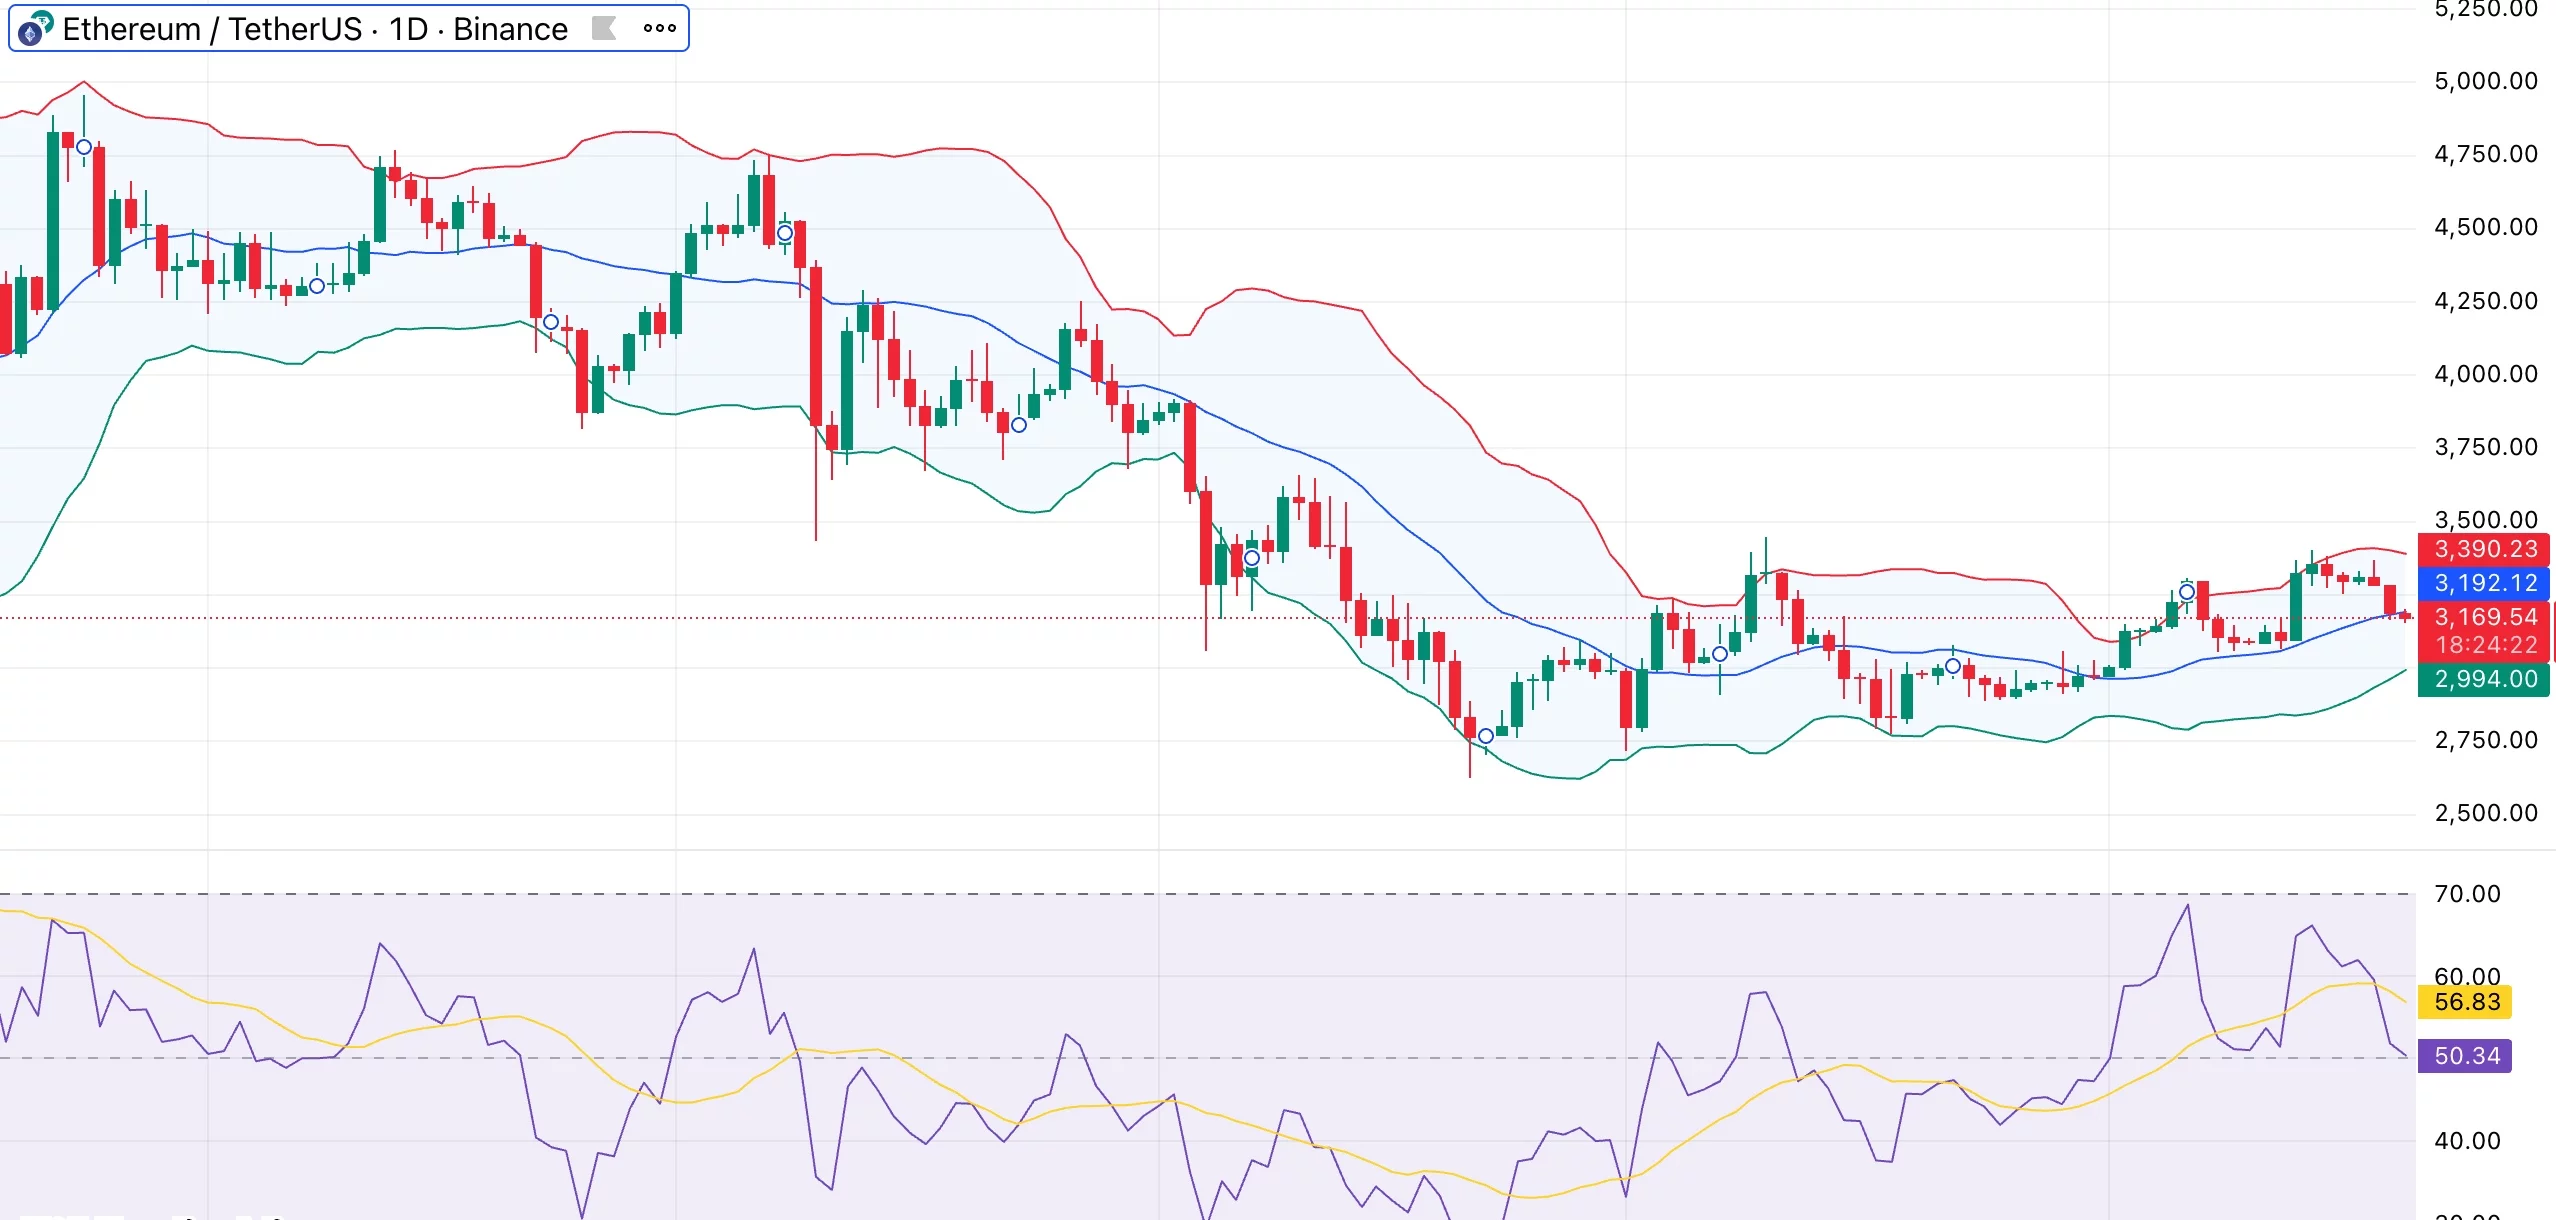
The Bollinger Bands are tightening, indicating reduced volatility. While this doesn’t show the direction of the next move, squeezes like this often come before a stronger breakout. ETH is also hovering near the midpoint of the bands, which typically reflects a sideways phase.

ETH is still above its 50-day moving average, which has served as a floor on several occasions in recent drops. The overall structure has remained intact because each pullback has attracted buyers, frequently at increasingly higher levels. 

While momentum hasn’t drastically decreased, it has eased in comparison to previous stages. The daily RSI is now slightly above 50 and has moved closer to neutral, indicating some buyer hesitancy without much seller pressure.

Volume is still low, and there hasn’t been much follow-through on recent attempts to push higher. A clean daily close above $3,400 would cause momentum to change and pave the way for the $3,650–$3,800 range. 

However, a pullback towards $3,050 to $3,100, where buying interest has previously emerged, could result from repeated failure at resistance. Overall, Ethereum is now in a holding pattern.

Market Opportunity
Ethereum Logo
Ethereum Price(ETH)
$2,123.75
$2,123.75$2,123.75
-1.30%
USD
Ethereum (ETH) Live Price Chart
Disclaimer: The articles reposted on this site are sourced from public platforms and are provided for informational purposes only. They do not necessarily reflect the views of MEXC. All rights remain with the original authors. If you believe any content infringes on third-party rights, please contact service@support.mexc.com for removal. MEXC makes no guarantees regarding the accuracy, completeness, or timeliness of the content and is not responsible for any actions taken based on the information provided. The content does not constitute financial, legal, or other professional advice, nor should it be considered a recommendation or endorsement by MEXC.

You May Also Like

Why Multicoin Capital’s Kyle Samani Is Leaving Crypto for AI and Robotics

Why Multicoin Capital’s Kyle Samani Is Leaving Crypto for AI and Robotics

TLDR Kyle Samani is stepping down as managing partner of Multicoin Capital after nearly a decade in the crypto industry He plans to explore other technologies including
Share
Coincentral2026/02/05 15:58
Bitcoin Bulls Need to Reclaim This Key Level for a New Run at $125K

Bitcoin Bulls Need to Reclaim This Key Level for a New Run at $125K

The post Bitcoin Bulls Need to Reclaim This Key Level for a New Run at $125K appeared on BitcoinEthereumNews.com. Key points: Bitcoin bulls are busy flipping key levels back to support; can they crack $118,000 next? New all-time highs are on the horizon if the Fed reaction uptrend continues. Exchange traders are already bringing in large lines of liquidity on either side of price. Bitcoin (BTC) sought to flip $117,000 to support on Thursday as the Federal Reserve interest-rate cut boosted crypto markets. BTC/USD one-hour chart. Source: Cointelegraph/TradingView Watch these Bitcoin price levels next, say traders Data from Cointelegraph Markets Pro and TradingView showed BTC/USD gaining up to 1.3% after the daily close. Volatility hit as the US Federal Reserve announced its first rate cut of 2025, coming in at 0.25% to match market expectations. After a brief dip below $115,000, Bitcoin rebounded, liquidating both long and short positions to the tune of over $100 million over 24 hours. $BTC update: FOMC Price Action nailed 🔨 Boring Monday and Tuesday; Wednesday volatile with the classic retrace of an initial false move. $105M liquidated in 30mins during FOMC, that’s what it’s important to be aware of this. Absolutely love this market. Probably $120k next. https://t.co/azE7Fg6J10 pic.twitter.com/x3EPCmIlOx — CrypNuevo 🔨 (@CrypNuevo) September 17, 2025 Among traders, hopes were high that bulls would cement support and continue on to challenge all-time highs. “The more important part; will $BTC break through this crucial resistance zone?” crypto trader, analyst and entrepreneur Michaël van de Poppe queried in a post on X. An accompanying chart showed the bulls’ next battle at $118,000.  “All I’m sure about is that, once Bitcoin stabilizes, we’ll start to see big breakouts on Altcoins occur,” he added. BTC/USDT one-day chart with RSI, volume data. Source: Michaël van de Poppe/X Popular trader Daan Crypto Trades agreed on the significance of the $118,000 mark. During dovish comments by Fed Chair Jerome Powell…
Share
BitcoinEthereumNews2025/09/19 10:20
SUI Price Rebounds Above $1 as HashKey Enables Trading Support

SUI Price Rebounds Above $1 as HashKey Enables Trading Support

The post SUI Price Rebounds Above $1 as HashKey Enables Trading Support appeared on BitcoinEthereumNews.com. SUI price gives a major breakdown from the support
Share
BitcoinEthereumNews2026/02/05 16:32