Bitcoin is slipping as risk-off sentiment, fading momentum and a chorus of bearish chart signals put the market on edge, with traders zeroing in on $90,000 as theBitcoin is slipping as risk-off sentiment, fading momentum and a chorus of bearish chart signals put the market on edge, with traders zeroing in on $90,000 as the

Bitcoin price prediction: Is $90k the line in the sand?

Bitcoin is slipping as risk-off sentiment, fading momentum and a chorus of bearish chart signals put the market on edge, with traders zeroing in on $90,000 as the make-or-break level that could decide whether the pullback stabilizes—or deepens.

Table of Contents

  • Current market scenario
  • Brandt is bearish
  • On-chain data signals cooling momentum
  • Bitcoin price prediction: Key levels to watch

Without exaggeration, the risk does exist — but it is far from guaranteed.

Summary
  • Bitcoin is trading around $90,658, struggling to reclaim key resistance amid macro uncertainty and market weakness.
  • On-chain data, including CoinGlass’ NRPL metric, shows cooling momentum and slower profit-taking, signaling cautious market sentiment.
  • A push above $97K–$98K could restore bullish control, while losing $90K–$91K support increases the risk of a deeper pullback; next moves will shape the short- to medium-term BTC outlook.

Current market scenario

Bitcoin (BTC) is down about 2%, dropping below $92,000, it’s now under $91,000, and traders are keeping a close eye on this level — it could either hold and stabilize the price, or if it cracks, BTC might head lower.

Bitcoin price prediction: Is $90k the line in the sand? - 2

The pullback comes amid risk-off vibes, worries about President Trump’s tariffs, and general market weakness. Short-term support levels are giving way, signaling the bulls are losing strength.

On-chain data also shows profit-taking has slowed, which adds to the cautious mood.

Brandt is bearish

Peter Brandt, a trader with over 850,000 followers on X, added fuel to the Bitcoin debate on X, suggesting it could slide down to around $58,000–$62,000.

He points to a rising wedge that’s been building for months — a classic bearish setup signaling the bulls might be losing steam.

He was quick to say he’s not always right, noting he’s “wrong about 50% of the time” and that this is just a possibility. Even so, his warning has traders on edge, especially short-term ones.

Bitcoin still can’t reclaim major resistance, keeping the BTC forecast on the cautious side.

On-chain data signals cooling momentum

Some on-chain data suggests Bitcoin’s upward push is losing steam. CoinGlass’ NRPL metric — which tracks trader profits — has slipped slightly negative after months of strong positive numbers.

Bitcoin price prediction: Is $90k the line in the sand? - 3

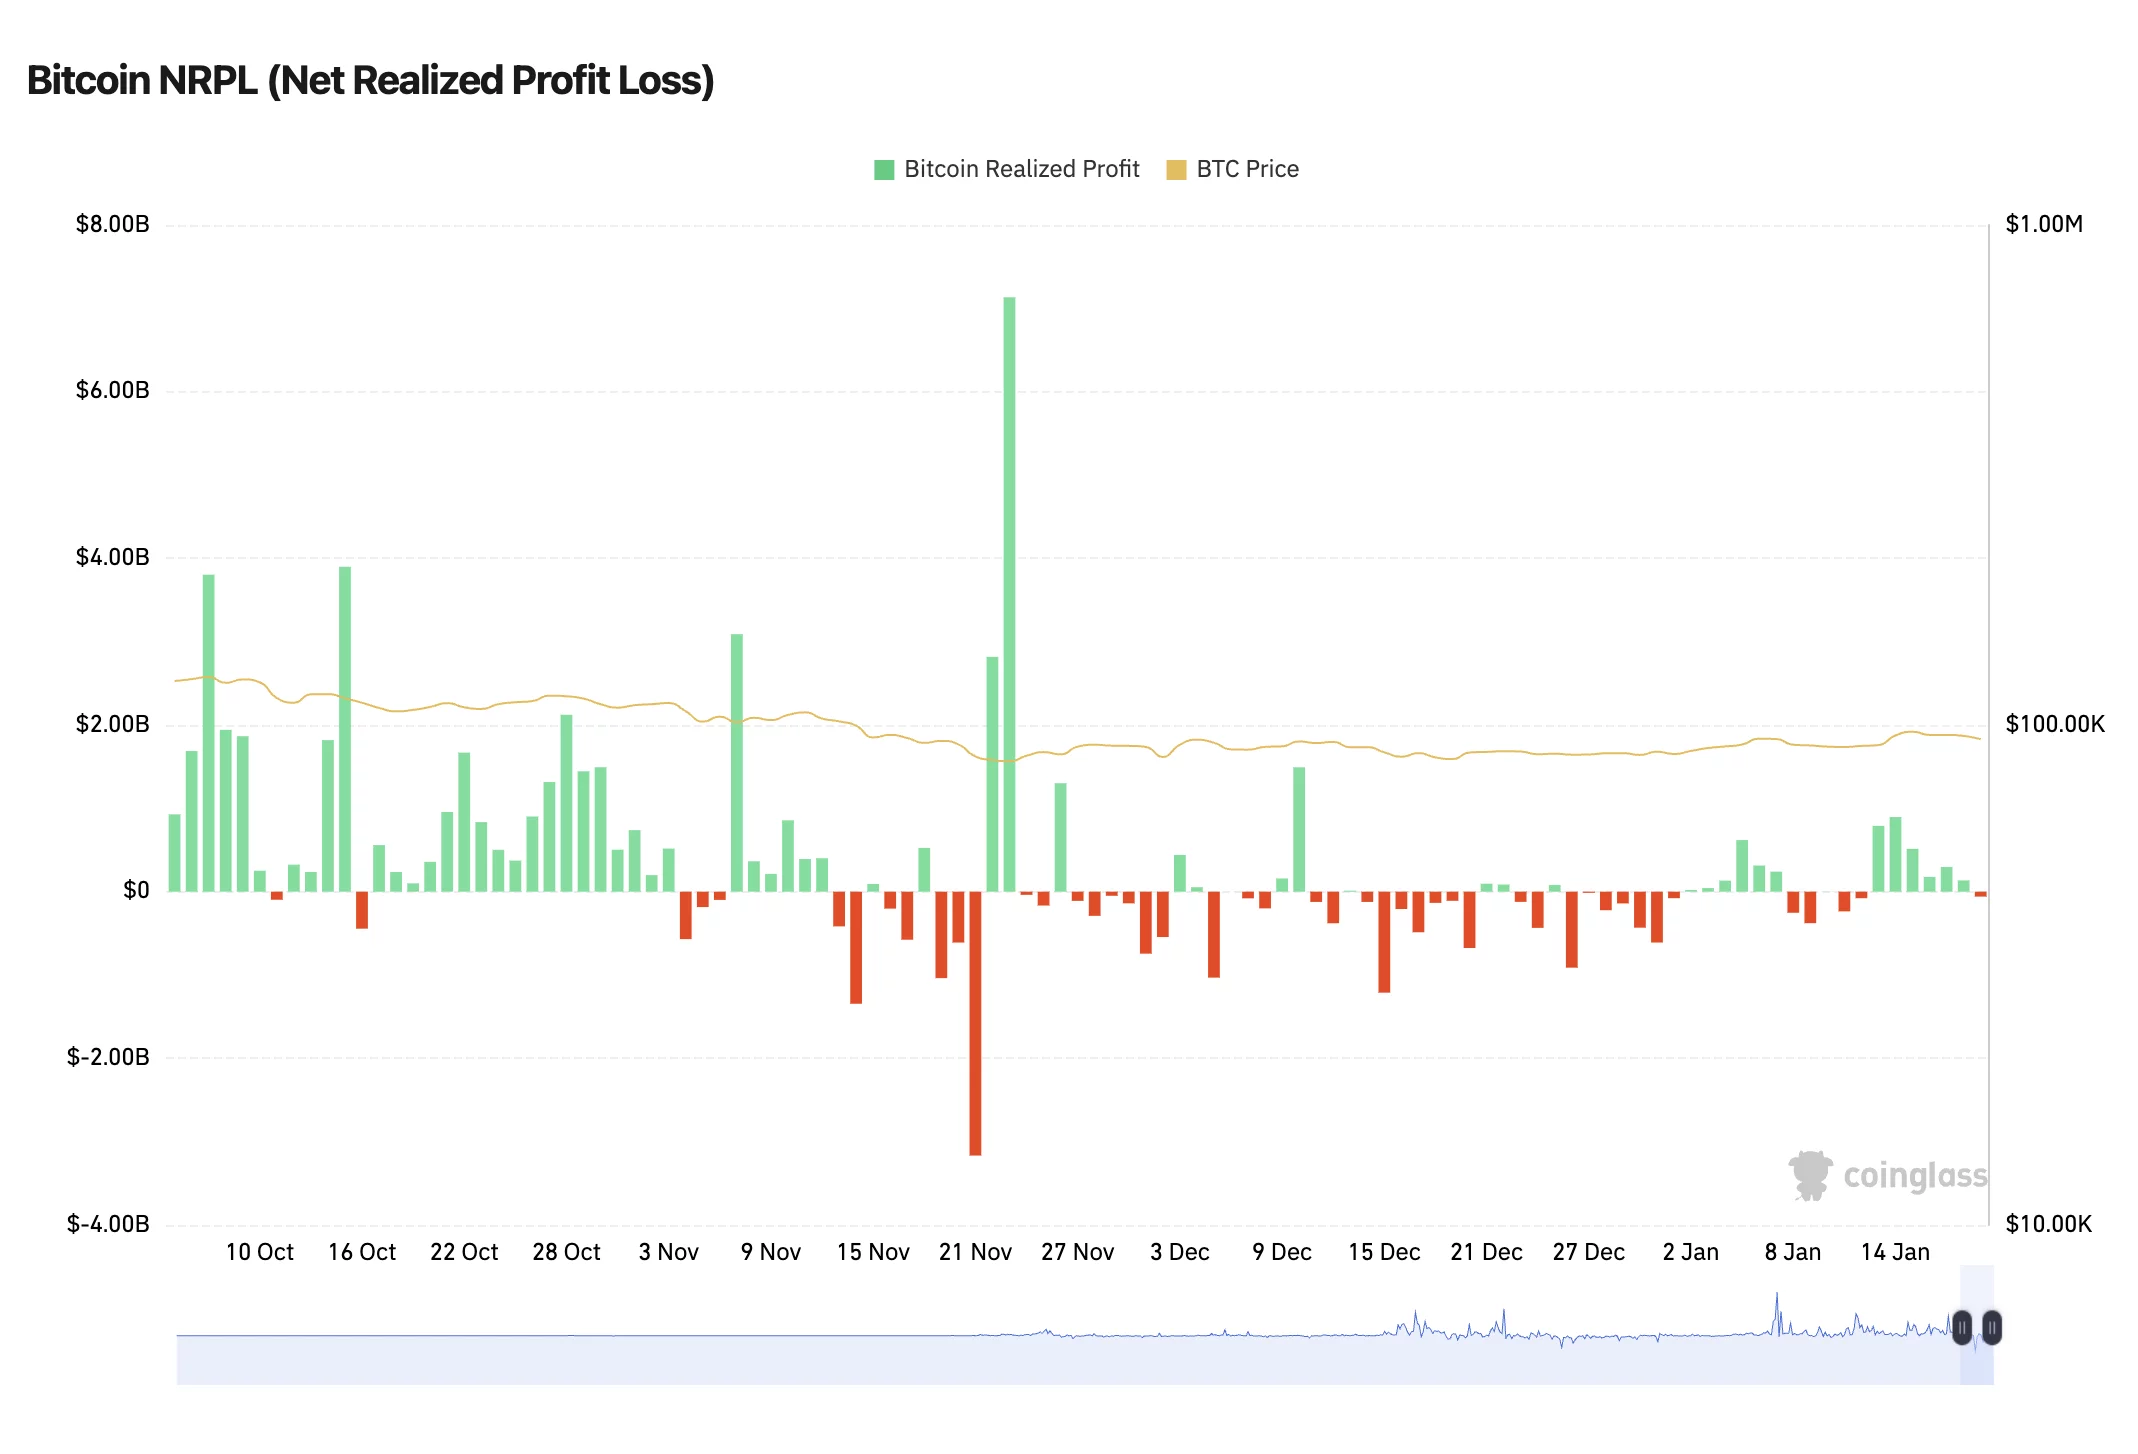
This tends to happen when buying interest cools off and the market is just absorbing selling. It doesn’t mean a meltdown is around the corner, but BTC could be more fragile if fresh buyers don’t jump in.

Bitcoin price prediction: Key levels to watch

If Bitcoin can push back above the $97,000–$98,000 range, it would signal that bulls are regaining control and could break the bearish trend, giving BTC a solid boost.

Looking to the downside, losing channel support at $90,000–$91,000 would raise the odds of a bigger pullback for Bitcoin. That could bring in $62,000, though it’s not a guaranteed outcome.

The Bitcoin price prediction is looking a bit hazy right now. Bearish charts and slowing on-chain activity are warning signs, but BTC has a way of surprising traders. The next moves will be key in shaping the short- to medium-term BTC outlook.

Market Opportunity
Sandbox Logo
Sandbox Price(SAND)
$0.1481
$0.1481$0.1481
+2.99%
USD
Sandbox (SAND) Live Price Chart
Disclaimer: The articles reposted on this site are sourced from public platforms and are provided for informational purposes only. They do not necessarily reflect the views of MEXC. All rights remain with the original authors. If you believe any content infringes on third-party rights, please contact service@support.mexc.com for removal. MEXC makes no guarantees regarding the accuracy, completeness, or timeliness of the content and is not responsible for any actions taken based on the information provided. The content does not constitute financial, legal, or other professional advice, nor should it be considered a recommendation or endorsement by MEXC.

You May Also Like

Microsoft Corp. $MSFT blue box area offers a buying opportunity

Microsoft Corp. $MSFT blue box area offers a buying opportunity

The post Microsoft Corp. $MSFT blue box area offers a buying opportunity appeared on BitcoinEthereumNews.com. In today’s article, we’ll examine the recent performance of Microsoft Corp. ($MSFT) through the lens of Elliott Wave Theory. We’ll review how the rally from the April 07, 2025 low unfolded as a 5-wave impulse followed by a 3-swing correction (ABC) and discuss our forecast for the next move. Let’s dive into the structure and expectations for this stock. Five wave impulse structure + ABC + WXY correction $MSFT 8H Elliott Wave chart 9.04.2025 In the 8-hour Elliott Wave count from Sep 04, 2025, we saw that $MSFT completed a 5-wave impulsive cycle at red III. As expected, this initial wave prompted a pullback. We anticipated this pullback to unfold in 3 swings and find buyers in the equal legs area between $497.02 and $471.06 This setup aligns with a typical Elliott Wave correction pattern (ABC), in which the market pauses briefly before resuming its primary trend. $MSFT 8H Elliott Wave chart 7.14.2025 The update, 10 days later, shows the stock finding support from the equal legs area as predicted allowing traders to get risk free. The stock is expected to bounce towards 525 – 532 before deciding if the bounce is a connector or the next leg higher. A break into new ATHs will confirm the latter and can see it trade higher towards 570 – 593 area. Until then, traders should get risk free and protect their capital in case of a WXY double correction. Conclusion In conclusion, our Elliott Wave analysis of Microsoft Corp. ($MSFT) suggested that it remains supported against April 07, 2025 lows and bounce from the blue box area. In the meantime, keep an eye out for any corrective pullbacks that may offer entry opportunities. By applying Elliott Wave Theory, traders can better anticipate the structure of upcoming moves and enhance risk management in volatile markets. Source: https://www.fxstreet.com/news/microsoft-corp-msft-blue-box-area-offers-a-buying-opportunity-202509171323
Share
BitcoinEthereumNews2025/09/18 03:50
WTI drifts higher above $59.50 on Kazakh supply disruptions

WTI drifts higher above $59.50 on Kazakh supply disruptions

The post WTI drifts higher above $59.50 on Kazakh supply disruptions appeared on BitcoinEthereumNews.com. West Texas Intermediate (WTI), the US crude oil benchmark
Share
BitcoinEthereumNews2026/01/21 11:24
Fed forecasts only one rate cut in 2026, a more conservative outlook than expected

Fed forecasts only one rate cut in 2026, a more conservative outlook than expected

The post Fed forecasts only one rate cut in 2026, a more conservative outlook than expected appeared on BitcoinEthereumNews.com. Federal Reserve Chairman Jerome Powell talks to reporters following the regular Federal Open Market Committee meetings at the Fed on July 30, 2025 in Washington, DC. Chip Somodevilla | Getty Images The Federal Reserve is projecting only one rate cut in 2026, fewer than expected, according to its median projection. The central bank’s so-called dot plot, which shows 19 individual members’ expectations anonymously, indicated a median estimate of 3.4% for the federal funds rate at the end of 2026. That compares to a median estimate of 3.6% for the end of this year following two expected cuts on top of Wednesday’s reduction. A single quarter-point reduction next year is significantly more conservative than current market pricing. Traders are currently pricing in at two to three more rate cuts next year, according to the CME Group’s FedWatch tool, updated shortly after the decision. The gauge uses prices on 30-day fed funds futures contracts to determine market-implied odds for rate moves. Here are the Fed’s latest targets from 19 FOMC members, both voters and nonvoters: Zoom In IconArrows pointing outwards The forecasts, however, showed a large difference of opinion with two voting members seeing as many as four cuts. Three officials penciled in three rate reductions next year. “Next year’s dot plot is a mosaic of different perspectives and is an accurate reflection of a confusing economic outlook, muddied by labor supply shifts, data measurement concerns, and government policy upheaval and uncertainty,” said Seema Shah, chief global strategist at Principal Asset Management. The central bank has two policy meetings left for the year, one in October and one in December. Economic projections from the Fed saw slightly faster economic growth in 2026 than was projected in June, while the outlook for inflation was updated modestly higher for next year. There’s a lot of uncertainty…
Share
BitcoinEthereumNews2025/09/18 02:59