

Why is the crypto market falling today? A clear, evidence based look
We explain the sequence of events, the measurable signals that mattered, and a compact checklist you can use to track whether the sell‑off is likely to continue. Use this as an educational guide and verify key data points with primary sources.
Quick take: Why is the crypto market falling today?
The short answer is that a mix of hawkish macro commentary and weaker risk appetite coincided with measurable on‑chain selling pressure, producing a rapid decline that traders and holders felt within hours. This framing matches major newswire reporting on the intraday move, which flagged central bank tone as a trigger for rapid outflows Reuters coverage.
On‑chain indicators that track exchange inflows and large transfers showed elevated activity before and during the drop, consistent with sellers moving assets to venues where they can be sold quickly Glassnode research.
Sign up for concise alerts and a monitoring checklist
If you want timely monitoring notes and a short checklist for the next 72 hours, sign up for FinancePolice email alerts with concise updates and primary‑source links.
Get monitoring checklist
Outcomes vary by coin and by investor time horizon. This piece is an evidence based snapshot, not financial advice, and aims to explain what happened and which signals matter next.
What happened today: a timeline of events behind this crypto crash today
09:00-11:00 local time, markets priced in firmer central bank language and a pullback in risk‑on flows. Major newswires reported that hawkish commentary shifted risk appetite, and crypto prices moved lower almost immediately as traders reacted to the macro tone Reuters coverage.
Shortly after the initial headlines, on‑chain tracking showed a rise in exchange inflows and several large wallet transfers, signals commonly associated with selling pressure or liquidity tapping Glassnode research. See additional reporting on whale movements Yahoo Finance coverage.
Across spot and derivatives venues, order books thinned and bid ask spreads widened as depth evaporated during the sharpest leg down, which increased price sensitivity to the inflows and any large market orders CoinMetrics data.
The impact was uneven by coin. Bitcoin showed early pressure via notable large transfers that fed the initial move, while some leveraged altcoins recorded proportionally larger drawdowns consistent with higher leverage exposure and thinner liquidity Glassnode research. A related on‑chain observability note is catalogued by Whale Alert Whale Alert story.

Central bank signals matter because they change the backdrop for risk assets. When officials speak in a firmer tone about rates or inflation, money that had flowed into higher risk pockets can reverse quickly as investors reprice expected returns across asset classes IMF analysis.
In practice, a hawkish comment can reduce risk‑on flows, tightening liquidity in markets where depth was already fragile. That makes it easier for a smaller volume of selling to move prices sharply.
A combination of hawkish macro commentary and elevated on‑chain exchange inflows appears to have triggered the move; monitor central bank communications, CPI and employment prints, and exchange flows to assess persistence.
Key macro data to watch in the immediate hours and days are CPI and employment prints and any follow up remarks from the Federal Reserve or other central banks, because these can confirm whether the hawkish tone is persistent IMF analysis.
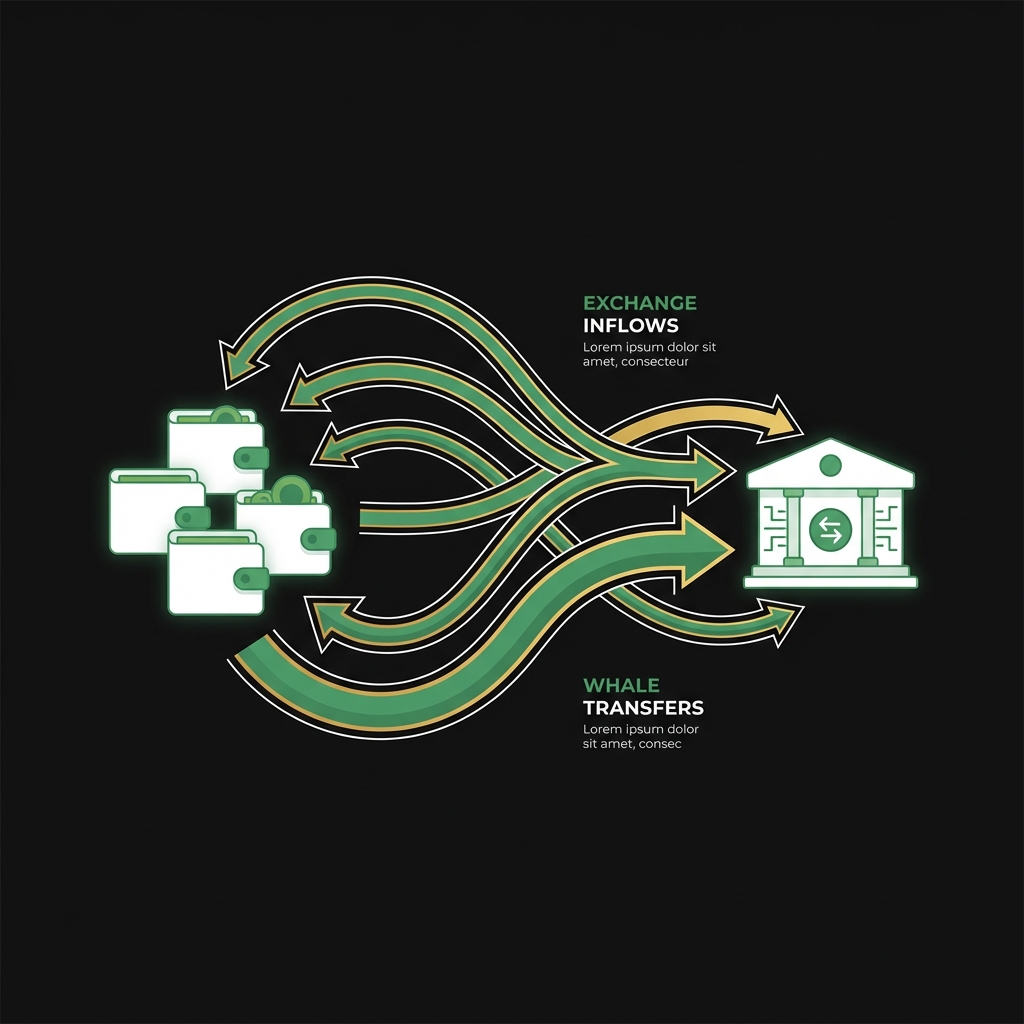
On-chain signals and exchange flows: what the data showed during the drop
On‑chain analytics recorded elevated exchange inflows and an increase in large wallet transfers before and during the decline, patterns that are often consistent with selling pressure or liquidity sourcing Glassnode research. For a complementary on‑chain rundown see Glassnode insights Glassnode insight.
Exchange inflows do not prove coordinated intent, but when inflows spike alongside large transfers and declining prices, they are a practical signal that more supply reached venues able to execute market sales Glassnode research.
Liquidity metrics from network and market data also showed thinning depth and wider bid ask spreads on major spot venues, which makes a given sell order move the market more; CoinMetrics documented related volume and volatility patterns during stressed episodes CoinMetrics data.
Use on‑chain indicators as one input: they help you see where supply is moving and whether exchanges are receiving more assets, but they are not a definitive explanation by themselves.
Regulatory and enforcement context that amplifies moves like this crypto crash today
Policy and enforcement developments since 2024 raised baseline volatility in digital‑asset markets, making prices more sensitive to shocks that previously might have caused only modest moves BIS discussion.
When market participants perceive enforcement or new guidance as imminent, they can reduce exposure quickly to avoid regulatory risk, which amplifies sell‑offs when macro shocks arrive. The specific effect depends on the jurisdiction and the asset.
A calm way to use this context is to treat regulatory headlines as a volatility multiplier rather than as a sole cause; regulatory steps can make a macro shock have a stronger price impact.
Liquidity, derivatives and market structure: why price moves got larger
Markets with thinner spot depth and concentrated derivatives positions tend to move more for any given volume of selling; wider bid ask spreads increase realized volatility because buyers and sellers cross worse prices to complete trades CoinMetrics data.
Leverage magnifies this effect. When leveraged positions move against holders, margin calls and forced liquidations can create cascades that worsen price action, especially on venues with concentrated liquidity Glassnode research.
That explains why some altcoins showed larger proportional drops while Bitcoin led the initial leg lower: differences in market depth, derivatives open interest, and who holds the positions change how a shock propagates. See our deeper coverage in this Bitcoin price analysis.
A simple framework to judge whether this crypto crash today is short lived or persistent
Use a three‑question checklist: 1) Is macro risk still rising, 2) Are exchange inflows continuing, and 3) Is liquidity recovering on spot and derivatives venues. Weight central bank moves most heavily, then on‑chain flows, then order book recovery IMF analysis.
Apply the checklist in order: if macro prints or central bank remarks worsen, that raises the chance of a persistent move. If macro signals calm but inflows stop and depth returns, the move is more likely to be a short lived repricing Glassnode research.
a compact tracker to log macro prints, exchange flows, and liquidity status
Use daily entries
Keep in mind that this framework is a practical guide, not a predictor. It helps organize observable signals so you can make a measured decision that fits your time horizon and risk tolerance.
Key indicators to watch next after a crypto crash today
Top macro items: upcoming Fed statements, CPI releases, and employment numbers. These items often lead and can confirm whether the hawkish tone is temporary or persistent IMF analysis.
On‑chain items to monitor: net exchange inflows and large wallet transfers, which indicate immediate selling pressure or liquidity sourcing Glassnode research.
Market structure signs to watch: narrowing bid ask spreads, recovered order book depth, and falling realized volatility. Improvements here reduce the odds that small orders move the market sharply CoinMetrics data.
Why coin by coin effects differ during a crypto crash today
Bitcoin often leads initial moves through large transfers between wallets and exchanges, so tracking its liquidity and large transfers can give an early signal of pressure Glassnode research.
Leveraged altcoins can fall more because thin order books mean a given sell order consumes more price levels, and higher derivatives open interest can trigger larger forced unwinds.
That is why a single market shock produces uneven outcomes across coins: liquidity, open interest, and holder composition matter more than the macro event alone.
Before acting, ask: What is my time horizon? What is my risk tolerance? How much liquidity do I need in the next 6 to 12 months? These three questions should guide any change to positions IMF analysis.
Instead of reacting to a headline, monitor the checklist signals: if central bank commentary eases, exchange inflows decline, and liquidity begins to recover, that lowers the case for urgent reallocation. If not, consider staged or partial adjustments based on your plan.
Verify headlines and flows with primary sources and, if you need tailored guidance, consult a qualified advisor. FinancePolice is an educational resource to help you interpret signals and plan next steps. See more in our crypto coverage.
Common mistakes and pitfalls when interpreting a crypto crash today
One common error is assuming exchange inflows are proof of coordinated selling. Inflows can reflect portfolio rebalancing, market making, or liquidity management and should be assessed alongside price action Glassnode research.
Another mistake is overreacting to media headlines without checking liquidity and positioning metrics. Headlines can compress complex market dynamics into a simple narrative that misses key flow data CoinMetrics data.
A final pitfall is confusing short term noise with a change in long term fundamentals. Use the checklist and primary sources to separate temporary repricings from sustained trends.
Practical scenarios: three plausible reader situations and what the signals would look like
Scenario A, transient risk repricing: hawkish comments fade, CPI or employment prints disappoint the hawkish read, exchange inflows decline, and order book depth returns. Prices recover over days to weeks IMF analysis.
Scenario B, liquidation cascade and amplified sell‑off: macro prints worsen, exchange inflows persist, and derivatives venues show rising forced liquidations as open interest compresses. This can prolong and deepen the fall Glassnode research.
Scenario C, regulatory shock with persistent effects: a high profile enforcement action or binding guidance increases baseline volatility and leads to longer term repricing, especially for affected tokens or firms SEC releases.
Wrap up: how to stay informed after this crypto crash today
In the next 24 to 72 hours, focus on three things: central bank communications and macro prints, exchange inflows and large wallet activity, and order book depth and bid ask spreads returning to normal Glassnode research.
Check primary sources for each signal before acting and use a simple tracker to log changes day to day. FinancePolice aims to clarify the data and provide practical checklists so readers can make informed decisions and verify details with primary sources or advisors. For recent market writeups see this related Bitcoin analysis.
News of firmer central bank language that reduced risk appetite combined with elevated exchange inflows and large wallet transfers appears to have caused rapid selling and thinner order books, producing the drop.
Watch central bank communications and major macro prints, monitor exchange inflows and large wallet transfers, and check whether order book depth and bid ask spreads recover; improvements across these areas suggest a shorter correction.
Decisions depend on your time horizon, risk tolerance, and liquidity needs; use the checklist to assess observable signals and verify headlines with primary sources before making a change.
If you need tailored advice, speak to a qualified professional. FinancePolice provides educational context to help you interpret the data and plan your next steps.
References
- https://www.reuters.com/technology/cryptocurrency-prices-plunge-amid-macro-jitters-2026-01-29/
- https://glassnode.com/research
- https://financepolice.com/advertise/
- https://coinmetrics.io/data/
- https://www.imf.org/en/Publications/GFSR
- https://www.bis.org/publ/othp33.htm
- https://insights.glassnode.com/the-week-onchain-week-02-2026/
- https://finance.yahoo.com/news/large-bitcoin-whale-accumulation-exchange-133534111.html
- https://whale-alert.io/stories/9375c43e251f/On-chain-whale-accumulation-was-exchange-internal-consolidation-true-whales-and-mid-size-holders-net-sold-in-December-coinciding-with-a-price-drop
- https://financepolice.com/bitcoin-price-analysis-btc-slips-below-90000-as-leveraged-liquidations-rock-market/
- https://financepolice.com/bitcoin-price-analysis-btc-dips-below-90000-amid-fading-risk-appetite/
- https://financepolice.com/category/crypto/
- https://www.sec.gov/news/press-releases
You May Also Like
Tesla Stock Forecast: Will $1.25T SpaceX-xAI Merge Boost TSLA?
Moku Pledges $1M to Launch Grand Arena Season One, a 24/7 AI-Athlete Fantasy Platform

