Cardano (ADA) Price: On-Chain Data Shows Whale Accumulation After Recent Drop
TLDR
- Cardano (ADA) price dropped over 17% in one week, falling from late January to early February and reaching lows near $0.26.
- The cryptocurrency is trading inside a bearish channel with key resistance at $0.34 and critical support at $0.28.
- On-chain data shows selling pressure has decreased from 168 million to 40 million ADA, indicating fewer coins are moving.
- Whale wallets holding between 10 million and 100 million ADA increased holdings slightly from 13.36 billion to 13.5 billion ADA.
- A daily close below $0.28 could trigger another drop toward $0.18, representing a potential 34% decline from current levels.
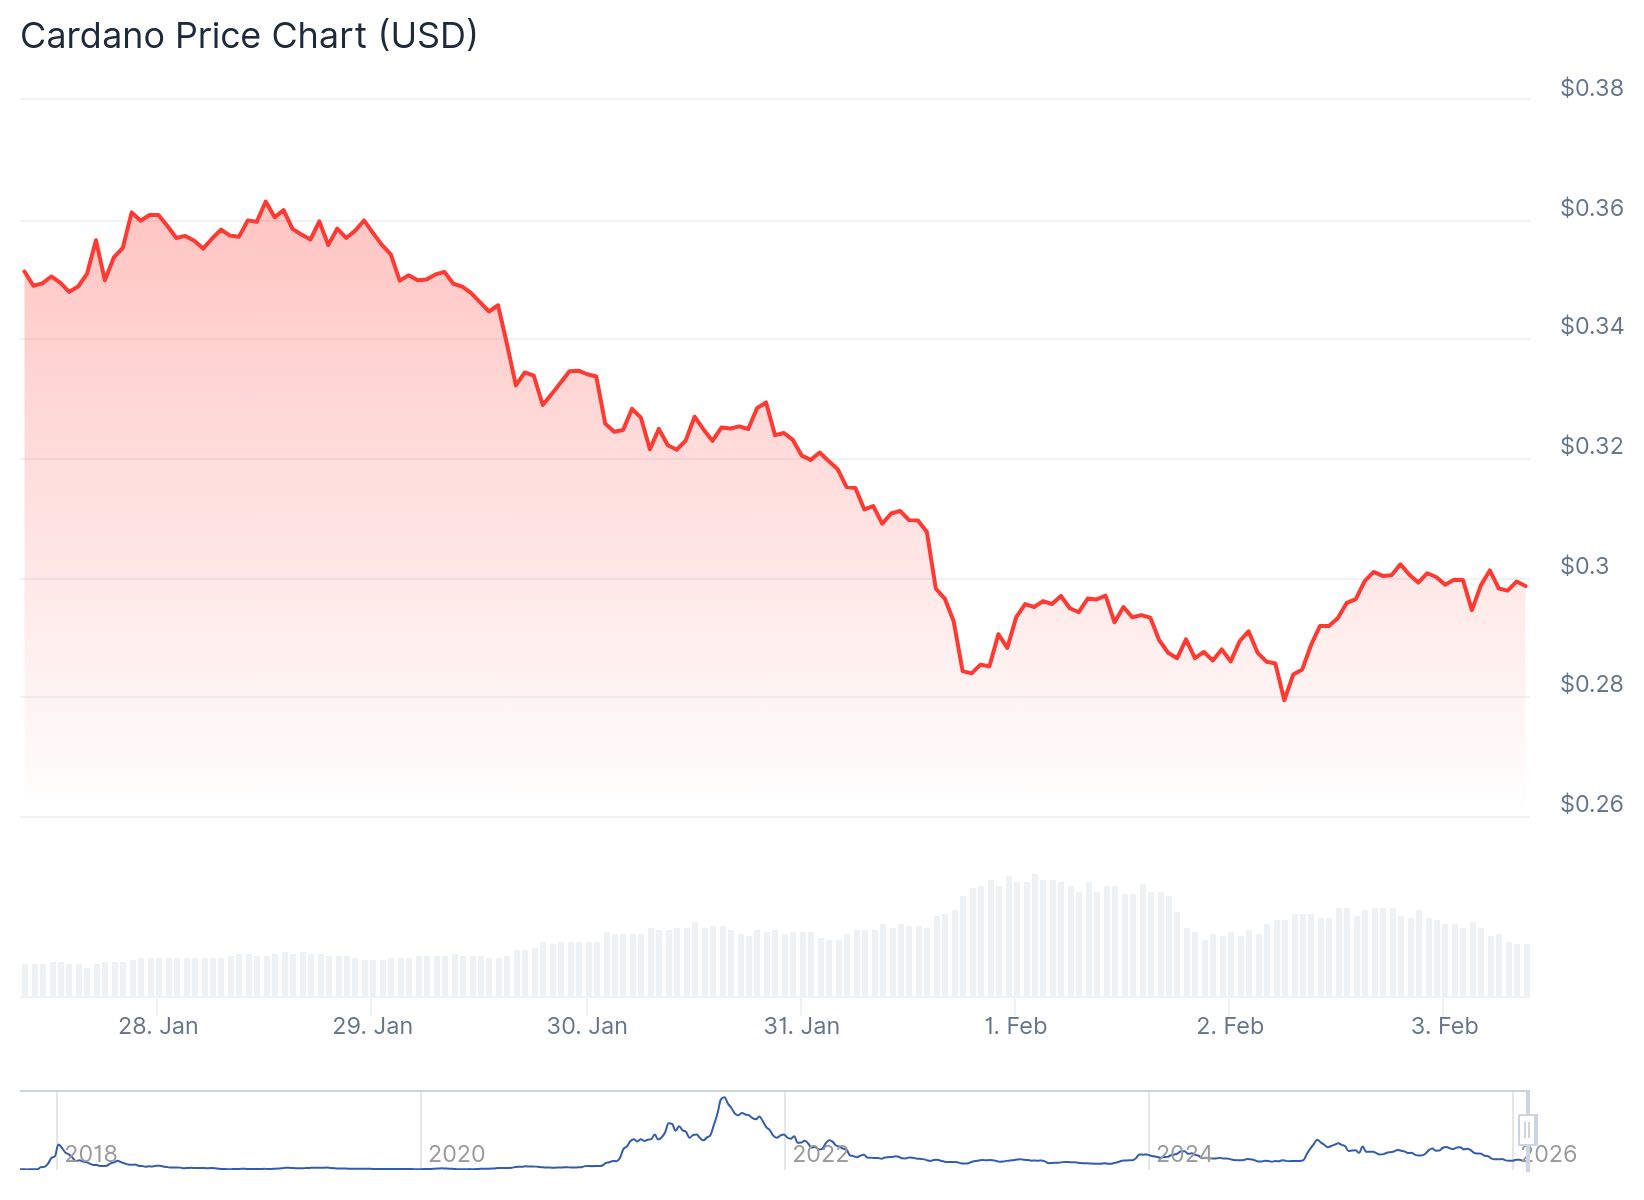
Cardano price has experienced strong downward pressure over the past seven days. The cryptocurrency fell more than 17% between late January and early February.
 Cardano (ADA) Price
ADA price dropped close to the $0.28 level during this period. At one point, the price dipped as low as $0.26 before recovering slightly.
The decline comes as part of a broader pattern that started in December. After reaching a peak that month, Cardano began forming lower highs and lower lows.
This price action created a falling channel pattern on the chart. The cryptocurrency remains trapped inside this bearish channel despite recent bounces.
 Source: TradingView
The current trading price sits near $0.28. This level has become the main support zone for now.
Buyers have attempted to push prices higher but have not succeeded in breaking key resistance levels. The most important resistance zone sits around $0.34.
This area aligns with the 0.618 Fibonacci level and previous support that turned into resistance. If Cardano cannot reclaim this zone, most bounce attempts may fail.
Technical Indicators Show Weak Momentum
The Relative Strength Index formed a bullish divergence between November and January. As the price made lower lows, the RSI trended upward.
This divergence helped trigger the bounce from $0.26 back to $0.28. However, the RSI remains below the 50 level.
This positioning indicates that momentum stays weak overall. Strong recoveries typically see RSI move above 50 and hold that level.
The indicator is also far from previous bullish peaks. It is moving in line with price rather than showing strong separation.
On-Chain Activity Drops Sharply
The Spent Coins Age Band metric surged to around 168 million ADA between January 25 and January 31. This spike matched the sharp sell-off at the end of January.
Since then, activity has dropped dramatically. The metric has fallen to around 40 million ADA, close to a three-month low.
This decline shows that fewer coins are moving on the network. Large holders and long-term investors are no longer rushing to sell.
When panic selling ends, this type of behavior often emerges. The drop in activity suggests selling pressure has cooled down.
Wallets holding between 10 million and 100 million ADA increased their holdings. Their balance rose from about 13.36 billion to 13.5 billion ADA.
This increase shows some cautious buying from whale addresses. However, other major holder groups have not joined in strongly.
Price Faces Critical Test
The $0.28 support level has held for the moment. But if ADA closes below this level on a daily basis, selling pressure could increase quickly.
In that scenario, the next major support sits near $0.18. This would represent another drop of around 34% from current levels.
Open Interest remained elevated on February 2 despite the price not rising. OI had consistently stayed high throughout the decline.
By mid-January, Open Interest had surged to $840 million. This increase reflected bears positioning themselves rather than bullish sentiment.
 Source: CryptoQuant
A reversal to $0.32 with rising Open Interest would signal bulls taking control. Whale orders have surged with each price dip according to recent data.
Major players bought after Cardano fell below $0.80. This front-running strategy has worked before and signals accumulation.
The cryptocurrency tested its critical support at $0.267 on February 2. It then bounced back to $0.28 as it sought stability.
The RSI dropped below 30, a level that had marked previous bottoms below $0.30. However, every previous bounce from these levels had been volatile.
The post Cardano (ADA) Price: On-Chain Data Shows Whale Accumulation After Recent Drop appeared first on CoinCentral.


You May Also Like

AI giants Meta, Microsoft, NVIDIA stocks slip amid Iran threat, AI cryptos crash

US, Iran ship seizures violate international law, disrupt Hormuz traffic