The historical pattern ot ETH price shows repeated expansion phases followed by progressively lower return multiples, suggesting maturation rather than exhaustionThe historical pattern ot ETH price shows repeated expansion phases followed by progressively lower return multiples, suggesting maturation rather than exhaustion

Ethereum’s History Shows Macro Cycles Are Still Intact

2026/02/05 07:44
3 min read

The historical pattern ot ETH price shows repeated expansion phases followed by progressively lower return multiples, suggesting maturation rather than exhaustion.

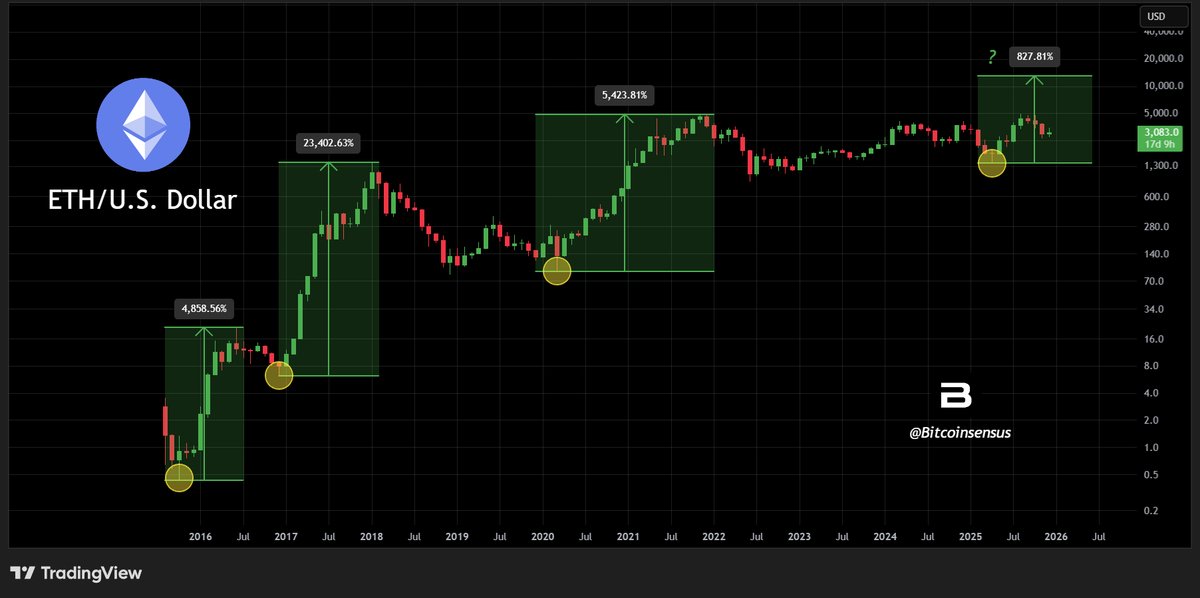
At the current point on the chart, Ethereum is trading around $3,083, positioned within what appears to be the early-to-mid phase of a new macro cycle rather than a terminal extension.

Macro Cycle Structure: Expansion Still Present, But Less Explosive

The chart maps three completed Ethereum macro cycles, each measured from cycle low to peak:

Source: https://x.com/Bitcoinsensus/status/2019093845225664534
  • First cycle: ~50x return
  • Second cycle: ~235x return
  • Third cycle: ~55x return

Despite differences in magnitude, all three cycles share a common structure:
a prolonged accumulation base → a sustained expansion phase → a corrective reset that holds well above prior cycle lows.

What has changed over time is scale. The second cycle delivered outsized gains during Ethereum’s early monetization phase. Subsequent cycles show significantly lower multiples, reflecting deeper liquidity, broader participation, and reduced reflexivity.

This does not negate upside potential. It reframes it.

Current Positioning: Cycle Progression, Not Cycle Peak

The rightmost section of the chart highlights the current cycle, with price having already advanced substantially off prior lows. The annotated projection range visible on the chart suggests a much smaller percentage expansion than earlier cycles, consistent with the long-term compression trend.

Importantly, Ethereum remains well above its previous cycle floor, maintaining the higher-low structure that has defined its macro uptrend since inception. There is no visible breakdown of long-term structure in the chart provided.

This places the market in a different regime than early-cycle parabolic phases. Upside, if it develops, is more likely to be trend-driven and rotational, rather than explosive.

Euro Stablecoin Market Poised for 1,600x Explosion by 2030, S&P Global Predicts

Structural Implications: Maturity Over Mania

The declining return multiples reflect Ethereum’s transition from an emerging asset to a systemically relevant network. As market capitalization increases, sustaining triple-digit or multi-hundred-x cycles becomes structurally more difficult.

From a macro perspective, Ethereum’s behavior increasingly resembles that of a maturing technology platform rather than a speculative startup asset. Cycles still exist, but they operate within tighter bounds and require longer time horizons to unfold.

That shift has implications for expectations. Historical cycles provide context, not templates.

Market Takeaway

Ethereum’s macro chart shows a consistent cycle framework, but with clear diminishing returns across successive expansions. The current price region around $3,083 sits within that evolving structure, suggesting continuation of the cycle process rather than a repeat of early-stage extremes.

The key signal is not how large past cycles were, but how reliably Ethereum has preserved higher lows across them. As the asset matures, structure matters more than magnitude, and confirmation will depend on how the current cycle develops relative to that long-term framework.

The post Ethereum’s History Shows Macro Cycles Are Still Intact appeared first on ETHNews.

Market Opportunity
Ethereum Logo
Ethereum Price(ETH)
$2,123.75
$2,123.75$2,123.75
-1.30%
USD
Ethereum (ETH) Live Price Chart
Disclaimer: The articles reposted on this site are sourced from public platforms and are provided for informational purposes only. They do not necessarily reflect the views of MEXC. All rights remain with the original authors. If you believe any content infringes on third-party rights, please contact service@support.mexc.com for removal. MEXC makes no guarantees regarding the accuracy, completeness, or timeliness of the content and is not responsible for any actions taken based on the information provided. The content does not constitute financial, legal, or other professional advice, nor should it be considered a recommendation or endorsement by MEXC.
Tags:

You May Also Like

Why Multicoin Capital’s Kyle Samani Is Leaving Crypto for AI and Robotics

Why Multicoin Capital’s Kyle Samani Is Leaving Crypto for AI and Robotics

TLDR Kyle Samani is stepping down as managing partner of Multicoin Capital after nearly a decade in the crypto industry He plans to explore other technologies including
Share
Coincentral2026/02/05 15:58
Bitcoin Bulls Need to Reclaim This Key Level for a New Run at $125K

Bitcoin Bulls Need to Reclaim This Key Level for a New Run at $125K

The post Bitcoin Bulls Need to Reclaim This Key Level for a New Run at $125K appeared on BitcoinEthereumNews.com. Key points: Bitcoin bulls are busy flipping key levels back to support; can they crack $118,000 next? New all-time highs are on the horizon if the Fed reaction uptrend continues. Exchange traders are already bringing in large lines of liquidity on either side of price. Bitcoin (BTC) sought to flip $117,000 to support on Thursday as the Federal Reserve interest-rate cut boosted crypto markets. BTC/USD one-hour chart. Source: Cointelegraph/TradingView Watch these Bitcoin price levels next, say traders Data from Cointelegraph Markets Pro and TradingView showed BTC/USD gaining up to 1.3% after the daily close. Volatility hit as the US Federal Reserve announced its first rate cut of 2025, coming in at 0.25% to match market expectations. After a brief dip below $115,000, Bitcoin rebounded, liquidating both long and short positions to the tune of over $100 million over 24 hours. $BTC update: FOMC Price Action nailed 🔨 Boring Monday and Tuesday; Wednesday volatile with the classic retrace of an initial false move. $105M liquidated in 30mins during FOMC, that’s what it’s important to be aware of this. Absolutely love this market. Probably $120k next. https://t.co/azE7Fg6J10 pic.twitter.com/x3EPCmIlOx — CrypNuevo 🔨 (@CrypNuevo) September 17, 2025 Among traders, hopes were high that bulls would cement support and continue on to challenge all-time highs. “The more important part; will $BTC break through this crucial resistance zone?” crypto trader, analyst and entrepreneur Michaël van de Poppe queried in a post on X. An accompanying chart showed the bulls’ next battle at $118,000.  “All I’m sure about is that, once Bitcoin stabilizes, we’ll start to see big breakouts on Altcoins occur,” he added. BTC/USDT one-day chart with RSI, volume data. Source: Michaël van de Poppe/X Popular trader Daan Crypto Trades agreed on the significance of the $118,000 mark. During dovish comments by Fed Chair Jerome Powell…
Share
BitcoinEthereumNews2025/09/19 10:20
SUI Price Rebounds Above $1 as HashKey Enables Trading Support

SUI Price Rebounds Above $1 as HashKey Enables Trading Support

The post SUI Price Rebounds Above $1 as HashKey Enables Trading Support appeared on BitcoinEthereumNews.com. SUI price gives a major breakdown from the support
Share
BitcoinEthereumNews2026/02/05 16:32