

Can XRP price hold the $1.45 demand zone as key metric peaks?
XRP price is testing a critical demand zone near $1.45 as rising on-chain velocity and falling open interest hint at a decisive move ahead.
- XRP trades near $1.44 after sharp weekly losses, with sellers still dictating short-term direction.
- On-chain velocity has surged to yearly highs, suggesting heavy re-positioning as price weakens.
- A firm hold above $1.45 could spark a short bounce, while a breakdown risks deeper losses.
XRP was trading near $1.44 at press time, down about 10% over the past 24 hours, sliding to its lowest level since November 2024. The token has weakened across all major timeframes, falling 23% over the past week and nearly 40% over the past month.
Price action over the last seven days has remained confined between $1.44 and $1.88, with sellers maintaining control. Even so, market activity has picked up. XRP (XRP) recorded $5.07 billion in trading volume in the past 24 hours, up 25%. This points to heavy participation during the sell-off.
Derivatives data show a more cautious tone. CoinGlass figures indicate futures volume rose 17% to $7.94 billion, while open interest slipped 1.8% to $2.61 billion. This mix suggests that traders reducing leverage while spot activity rises, a setup that can appear near short-term turning points.
XRP velocity spikes as supply shifts hands
A Feb. 4 analysis by CryptoQuant contributor CryptoOnchain highlighted a sharp move in XRP Ledger activity. The seven-day SMA of XRP velocity climbed to 0.013 on Feb. 3, matching the highest levels seen since January 2025.
In previous cycles, this level has appeared at key moments. During this instance, the velocity increase coincided with a price decline, suggesting rapid coin movement rather than steady accumulation. Such conditions are often linked to older holdings changing hands or aggressive short-term trading during periods of stress.
According to the analyst, when velocity reaches its upper range while price struggles, it can mark a high-friction phase in the market. Whether this activity marks late-stage selling or the early stages of stabilization depends on how the price reacts around key support.
In a separate note, CryptoOnchain pointed to a sharp drop in XRP open interest on Binance, which has fallen to $405.9 million, the lowest level since November 2024.
A market reset of this size suggests that leverage has been significantly reduced. The probability of more forced sales drops as positions are unwound. This eases the influence of derivatives on short-term price moves.
Under these conditions, if spot demand holds up, any rebound is more likely to develop in a gradual and orderly way.
XRP price technical analysis
XRP is testing a clearly defined demand zone at $1.45, which has held during prior drops. The token is trading well below its 20-day moving average, placing the price in a stretched position.
XRP has also slipped below the lower Bollinger Band, which points to shrinking volatility. Instead of sellers running out of steam, the price action suggests heavy selling pressure pushing straight into support.
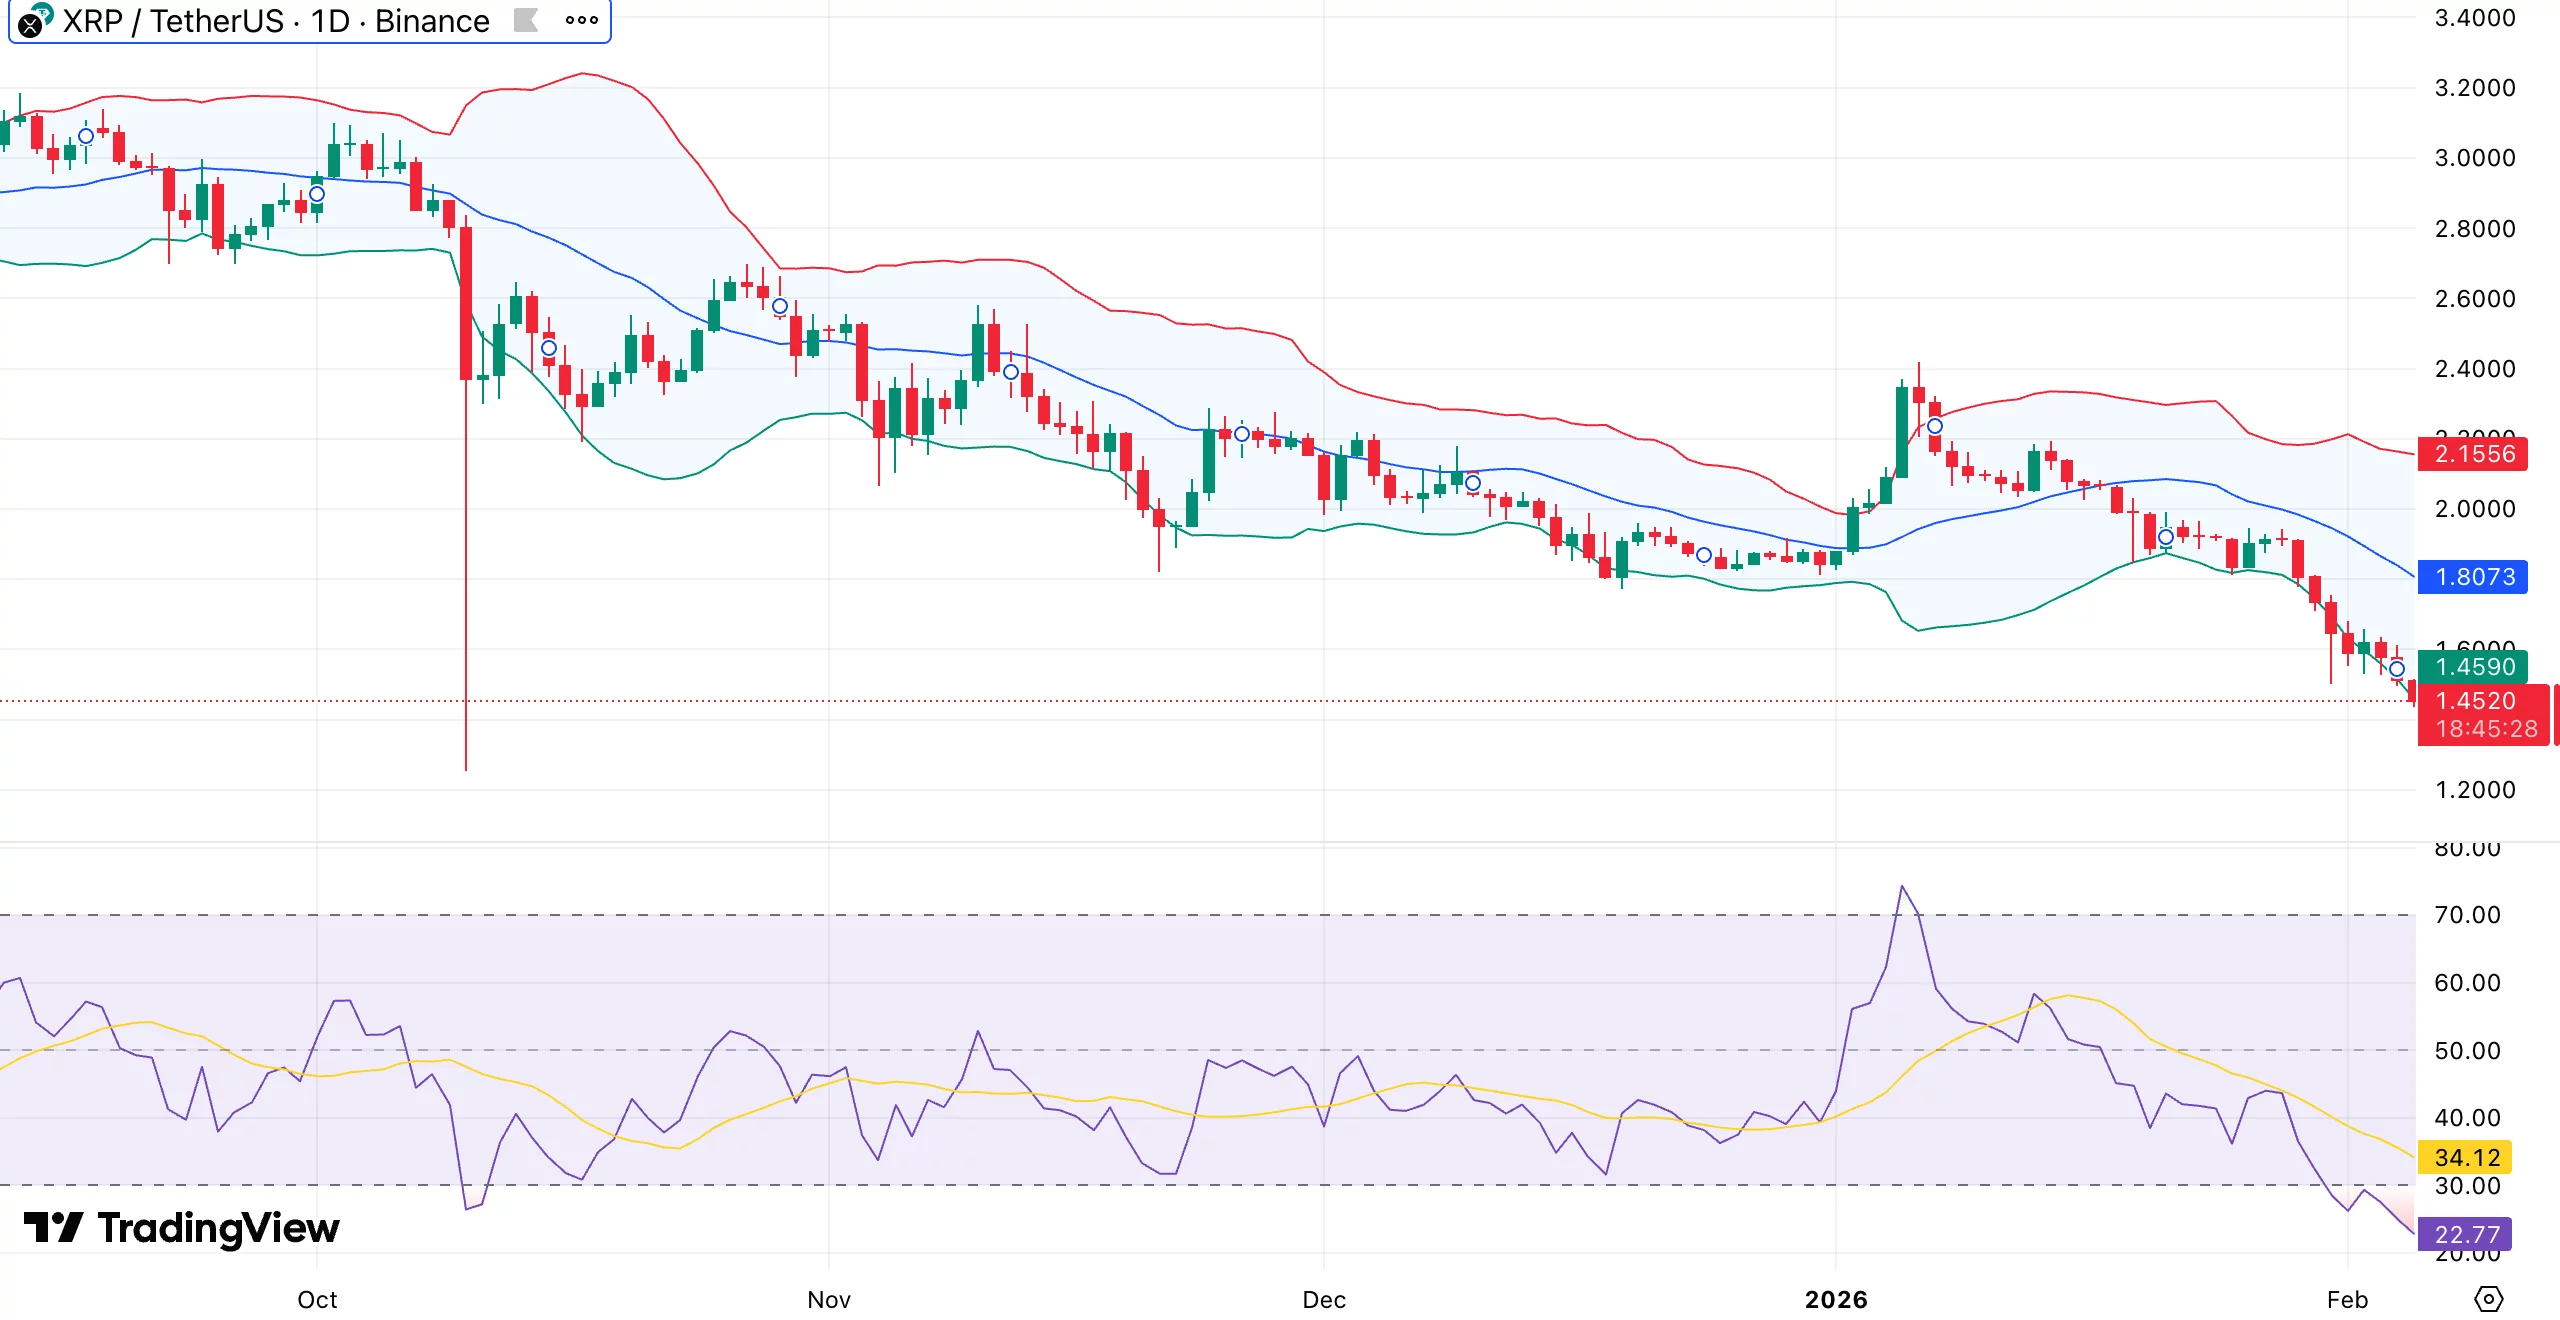
The relative strength index is in the low-30s, indicating that momentum is weak but getting closer to levels where selling pressure often slows.
Smaller bodies and longer wicks on recent candles suggest that sellers are meeting more resistance close to the current price. So far, the $1.45 level has not given way on a daily close.
If buyers continue to defend this zone, a short-term bounce toward $1.60–$1.70 becomes possible, driven by oversold conditions and reduced leverage. For the price to stabilize further, XRP would need to reclaim $1.80 and hold it.
Failure to hold $1.45 would change the picture quickly. A clean break below that level could open the door to deeper losses, as visible support becomes thinner beneath current prices.


You May Also Like

Why Bato didn’t get TRO in Supreme Court packed with Duterte appointees

Biographer shares sobering prediction about how Trump admin will end: 'This is it'

Kaspa Gained 10.02% in Last Month and is Predicted to Drop to $0.028204 By Apr 06, 2026


