TLDR DOGE RSI hits deep oversold, signaling seller exhaustion. 4H wedge breakout forms bullish cup-and-handle. MACD crossover supports short-term momentum shiftTLDR DOGE RSI hits deep oversold, signaling seller exhaustion. 4H wedge breakout forms bullish cup-and-handle. MACD crossover supports short-term momentum shift

Dogecoin Price Eyes Reversal as RSI, Patterns Signal Momentum Shift

2026/02/09 05:16
3 min read
For feedback or concerns regarding this content, please contact us at crypto.news@mexc.com

TLDR

  • DOGE RSI hits deep oversold, signaling seller exhaustion.
  • 4H wedge breakout forms bullish cup-and-handle.
  • MACD crossover supports short-term momentum shift
  • Weekly 0.786 Fib near $0.08 anchors key demand zone.

Dogecoin(DOGE) price is approaching a technically sensitive area as multiple indicators suggest downside momentum may be fading. Analysts tracking RSI behavior, intraday reversal formations, and weekly Fibonacci support noted convergence around the $0.08–$0.10 range. This cluster of signals is shaping expectations for stabilization after an extended correction.

Dogecoin Price Hits RSI Extreme on Daily Chart

According to analyst Trader Tardigrade, the daily structure shows momentum cycles aligning closely with RSI peaks and troughs. Previous tops formed as RSI entered overbought territory, warning that buyers were exhausted. The subsequent decline validated the oscillator as an early signal of distribution.

Moreover, the move lower unfolded without bullish divergence. RSI continued printing lower highs while price trended downward in an orderly fashion. This behavior pointed to a full sentiment reset rather than a temporary pullback. Sellers maintained control throughout the descent.Image

Now the indicator sits in deeply oversold territory. Historically, similar readings have marked late-stage sell pressure for Dogecoin price. While not a guarantee of reversal, such extremes often precede consolidation or relief bounces. Momentum, therefore, appears stretched after months of decline.

Cup-and-Handle Pattern Emerges After Wedge Breakout

Meanwhile, the 4-hour chart presents a more constructive technical picture. Tardigrade highlighted that DOGE recently broke out from a descending broadening wedge. This pattern often resolves upward as volatility compresses and supply weakens.

Following the breakout, Dogecoin price carved a rounded base that evolved into a recognizable cup formation. The subsequent handle developed through tight consolidation with limited retracement. Such structures typically represent continuation pauses rather than renewed selling.Image

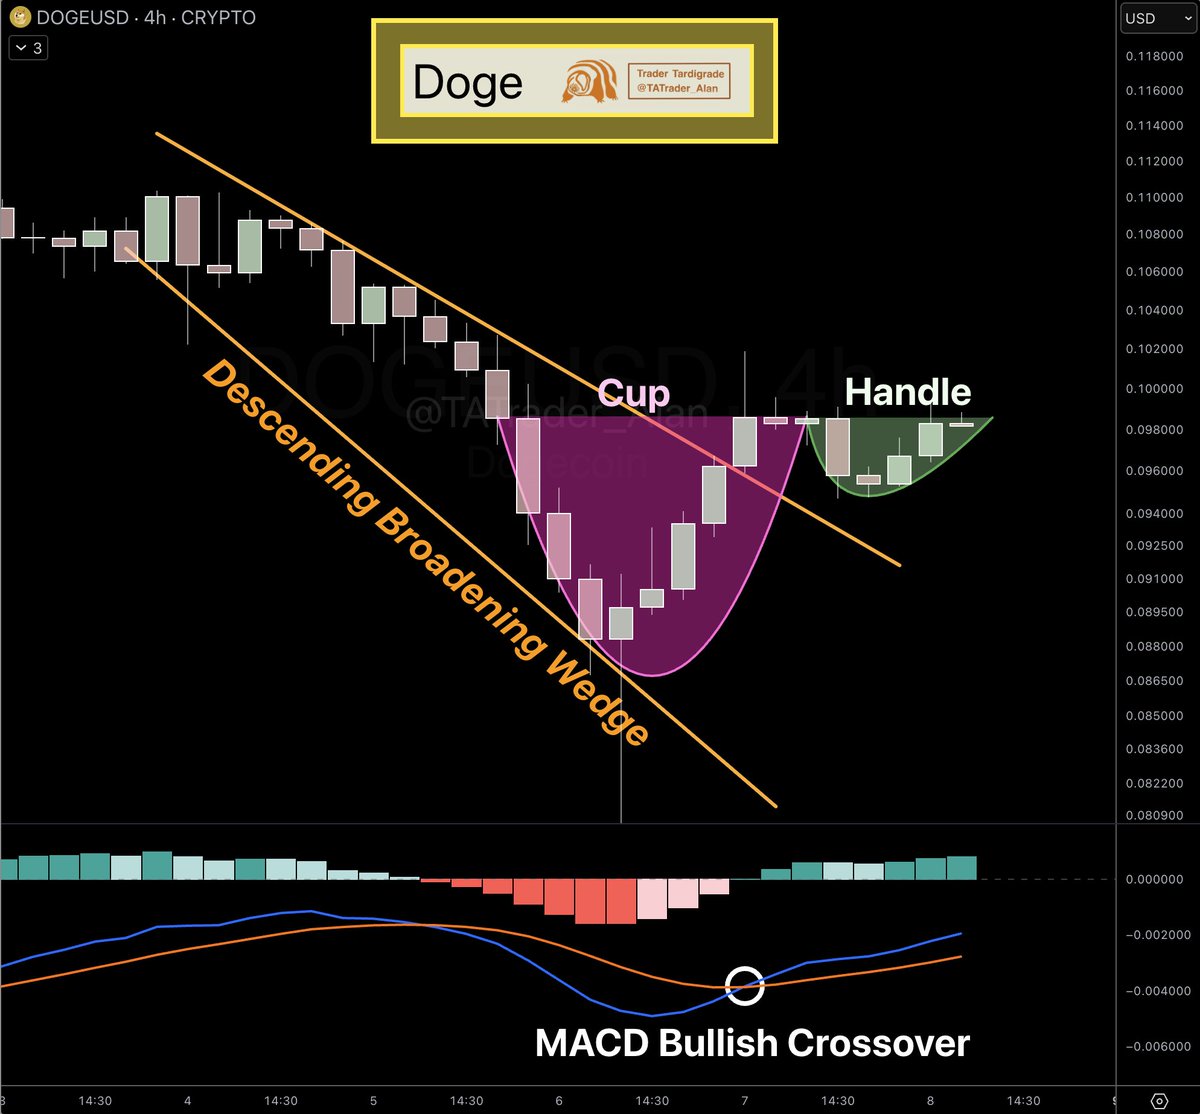
In addition, momentum indicators are beginning to confirm the shift. The MACD has delivered a bullish crossover, and histogram bars have turned positive. When improving momentum aligns with a cup-and-handle, traders often anticipate expansion. A move through handle resistance could attract increased participation.

Weekly Fibonacci Zone Anchors Market Structure

Furthermore, higher-timeframe analysis from analyst Surf emphasizes the importance of the 0.786 retracement near $0.08. This level derives from the prior macro advance and frequently acts as a final defense in corrections. Long-term participants often monitor such areas for evidence of absorption.

Price currently trades inside a broader demand band between $0.08 and $0.10. Historical interaction and volume clustering strengthen the region’s credibility. Repeated reactions here highlight its role across previous cycles. The market’s behavior within this band remains decisive.Image

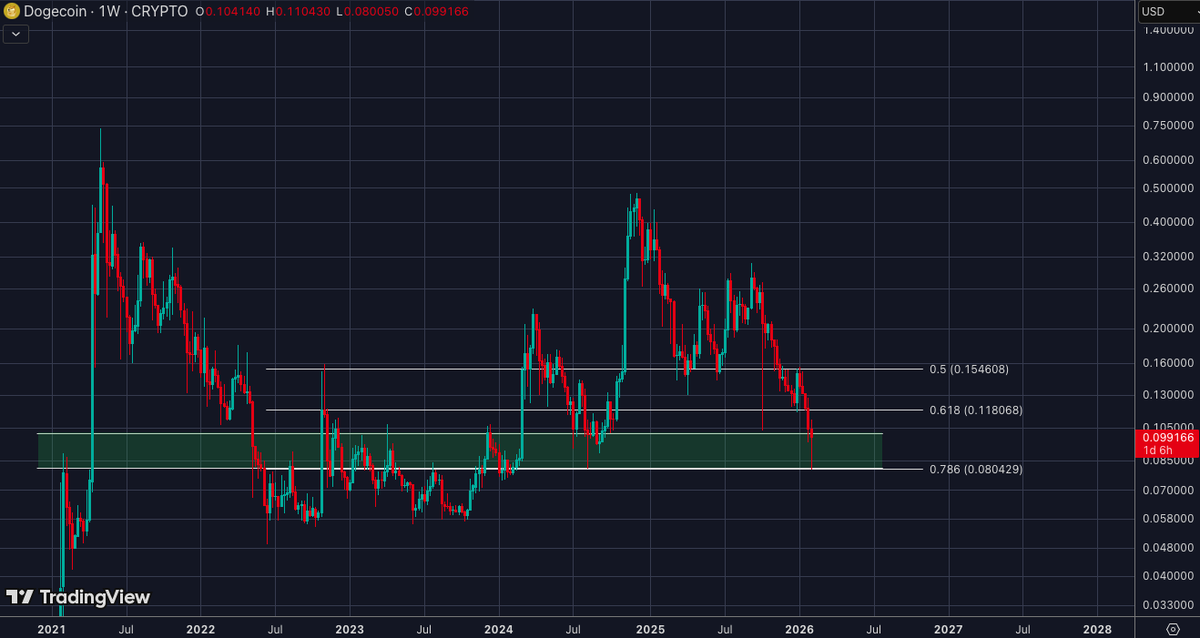
According to Surf, consolidation inside the range suggests accumulation dynamics may be developing. Downside momentum has moderated as price compresses near support. If weekly closes continue to defend the retracement, the broader structure would remain intact. This context aligns with improving signals seen on lower timeframes.

The post Dogecoin Price Eyes Reversal as RSI, Patterns Signal Momentum Shift appeared first on CoinCentral.

Market Opportunity
DOGE Logo
DOGE Price(DOGE)
$0.09615
$0.09615$0.09615
-2.92%
USD
DOGE (DOGE) Live Price Chart
Disclaimer: The articles reposted on this site are sourced from public platforms and are provided for informational purposes only. They do not necessarily reflect the views of MEXC. All rights remain with the original authors. If you believe any content infringes on third-party rights, please contact crypto.news@mexc.com for removal. MEXC makes no guarantees regarding the accuracy, completeness, or timeliness of the content and is not responsible for any actions taken based on the information provided. The content does not constitute financial, legal, or other professional advice, nor should it be considered a recommendation or endorsement by MEXC.

You May Also Like

Microsoft Corp. $MSFT blue box area offers a buying opportunity

Microsoft Corp. $MSFT blue box area offers a buying opportunity

The post Microsoft Corp. $MSFT blue box area offers a buying opportunity appeared on BitcoinEthereumNews.com. In today’s article, we’ll examine the recent performance of Microsoft Corp. ($MSFT) through the lens of Elliott Wave Theory. We’ll review how the rally from the April 07, 2025 low unfolded as a 5-wave impulse followed by a 3-swing correction (ABC) and discuss our forecast for the next move. Let’s dive into the structure and expectations for this stock. Five wave impulse structure + ABC + WXY correction $MSFT 8H Elliott Wave chart 9.04.2025 In the 8-hour Elliott Wave count from Sep 04, 2025, we saw that $MSFT completed a 5-wave impulsive cycle at red III. As expected, this initial wave prompted a pullback. We anticipated this pullback to unfold in 3 swings and find buyers in the equal legs area between $497.02 and $471.06 This setup aligns with a typical Elliott Wave correction pattern (ABC), in which the market pauses briefly before resuming its primary trend. $MSFT 8H Elliott Wave chart 7.14.2025 The update, 10 days later, shows the stock finding support from the equal legs area as predicted allowing traders to get risk free. The stock is expected to bounce towards 525 – 532 before deciding if the bounce is a connector or the next leg higher. A break into new ATHs will confirm the latter and can see it trade higher towards 570 – 593 area. Until then, traders should get risk free and protect their capital in case of a WXY double correction. Conclusion In conclusion, our Elliott Wave analysis of Microsoft Corp. ($MSFT) suggested that it remains supported against April 07, 2025 lows and bounce from the blue box area. In the meantime, keep an eye out for any corrective pullbacks that may offer entry opportunities. By applying Elliott Wave Theory, traders can better anticipate the structure of upcoming moves and enhance risk management in volatile markets. Source: https://www.fxstreet.com/news/microsoft-corp-msft-blue-box-area-offers-a-buying-opportunity-202509171323
Share
BitcoinEthereumNews2025/09/18 03:50
CME to launch Solana and XRP futures options on October 13, 2025

CME to launch Solana and XRP futures options on October 13, 2025

The post CME to launch Solana and XRP futures options on October 13, 2025 appeared on BitcoinEthereumNews.com. Key Takeaways CME Group will launch futures options for Solana (SOL) and XRP. The launch date is set for October 13, 2025. CME Group will launch futures options for Solana and XRP on October 13, 2025. The Chicago-based derivatives exchange will add the new crypto derivatives products to its existing digital asset offerings. The launch will provide institutional and retail traders with additional tools to hedge positions and speculate on price movements for both digital assets. The futures options will be based on CME’s existing Solana and XRP futures contracts. Trading will be conducted through CME Globex, the exchange’s electronic trading platform. Source: https://cryptobriefing.com/cme-solana-xrp-futures-options-launch-2025/
Share
BitcoinEthereumNews2025/09/18 01:07
US-Israel airstrikes trigger 700% surge in Iran crypto outflows

US-Israel airstrikes trigger 700% surge in Iran crypto outflows

The post US-Israel airstrikes trigger 700% surge in Iran crypto outflows appeared on BitcoinEthereumNews.com. Homepage > News > Business > US-Israel airstrikes
Share
BitcoinEthereumNews2026/03/05 16:01