Bitcoin’s $60K dip raises concerns over a potential prolonged downtrend. Analysts warn Bitcoin’s correction may lead to a deeper market slump. Will Bitcoin regainBitcoin’s $60K dip raises concerns over a potential prolonged downtrend. Analysts warn Bitcoin’s correction may lead to a deeper market slump. Will Bitcoin regain

Bitcoin’s $60,000 Dip: Is This the Bottom or Just the Start of a Deeper Bear Market?

2026/02/10 23:00
3 min read
  • Bitcoin’s $60K dip raises concerns over a potential prolonged downtrend.
  • Analysts warn Bitcoin’s correction may lead to a deeper market slump.
  • Will Bitcoin regain momentum soon, or face a prolonged bear market?

Bitcoin’s recent price plunge has sparked intense debate among analysts, with some suggesting that the dip to $59,930 could be a critical turning point in the current bear market. According to Kaiko’s latest research, the 32% correction marks the lowest point for Bitcoin since October 2024, just before the re-election of US President Donald Trump. This significant decline has led experts to question whether Bitcoin has already hit its bottom or if this is just the beginning of a more severe downturn.


Kaiko’s report argues that the market has moved past the post-halving euphoria and entered a typical bear market phase, which generally lasts around 12 months before a new accumulation phase takes hold. The analysis of on-chain metrics shows that Bitcoin is approaching critical technical support levels. These levels are crucial in determining whether the historical four-year halving cycle will remain intact, or if this cycle will deviate from expectations.


Additionally, Kaiko’s report highlights a 30% drop in aggregate spot crypto trading volume across the 10 leading centralized exchanges, from around $1 trillion in October 2025 to $700 billion in November. Furthermore, the combined open interest in Bitcoin and Ether futures has fallen by 14%, indicating that deleveraging is ongoing across the market.


Also Read: XRP’s Decentralization in Question: Ripple CTO Slams Bitcoin’s Centralization Failures!


A Bear Market or a Local Bottom?

Despite the correction, some market participants remain optimistic about Bitcoin’s future. Experts like Shawn Young, chief analyst at MEXC Research, believe that the catalysts behind Bitcoin’s previous rally to $126,000 are still at play. However, with oversold indicators emerging, there is speculation that Bitcoin’s recovery could be imminent.


The key question now is whether the $60,000 mark represents the bottom of the bear market. This price point aligns with Bitcoin’s 200-week moving average, which has historically served as a long-term support level. While this offers hope to some investors, others remain skeptical, with Nicolai Sondergaard from Nansen pointing out that it’s difficult to predict whether Bitcoin will follow its usual four-year cycle.
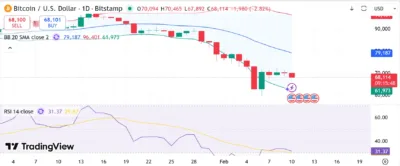

Bitcoin

Source: Tradingview

Kaiko’s research also suggests that the 52% retracement from Bitcoin’s previous all-time high is relatively shallow compared to prior cycles. Historically, Bitcoin has seen retracements of 60% to 68% during bear markets, which could indicate that the true bottom might lie closer to the $40,000 to $50,000 range. However, Bitcoin may have already found its local bottom at $60,000, showing a record-low investor sentiment and an oversold Relative Strength Index (RSI).


Also Read: Phantom Wallet’s Chat Feature Exposes Users to $264K Phishing Scam – Here’s How!


The post Bitcoin’s $60,000 Dip: Is This the Bottom or Just the Start of a Deeper Bear Market? appeared first on 36Crypto.

Market Opportunity
Ucan fix life in1day Logo
Ucan fix life in1day Price(1)
$0,0007189
$0,0007189$0,0007189
-7,57%
USD
Ucan fix life in1day (1) Live Price Chart
Disclaimer: The articles reposted on this site are sourced from public platforms and are provided for informational purposes only. They do not necessarily reflect the views of MEXC. All rights remain with the original authors. If you believe any content infringes on third-party rights, please contact service@support.mexc.com for removal. MEXC makes no guarantees regarding the accuracy, completeness, or timeliness of the content and is not responsible for any actions taken based on the information provided. The content does not constitute financial, legal, or other professional advice, nor should it be considered a recommendation or endorsement by MEXC.

You May Also Like

Next Big Crypto? 11B Tokens Sold as APEMARS Stage 7 Closes in 24 Hours – Top 100x Meme Coin 2026 Poised to Outshine Cyber and Floki

Next Big Crypto? 11B Tokens Sold as APEMARS Stage 7 Closes in 24 Hours – Top 100x Meme Coin 2026 Poised to Outshine Cyber and Floki

The meme-coin market is attracting attention as investors search for the next big crypto! Cyber (CYBER) surged 6.93% amid rising trading volume, showing traders
Share
Coinstats2026/02/13 10:15
BlackRock Increases U.S. Stock Exposure Amid AI Surge

BlackRock Increases U.S. Stock Exposure Amid AI Surge

The post BlackRock Increases U.S. Stock Exposure Amid AI Surge appeared on BitcoinEthereumNews.com. Key Points: BlackRock significantly increased U.S. stock exposure. AI sector driven gains boost S&P 500 to historic highs. Shift may set a precedent for other major asset managers. BlackRock, the largest asset manager, significantly increased U.S. stock and AI sector exposure, adjusting its $185 billion investment portfolios, according to a recent investment outlook report.. This strategic shift signals strong confidence in U.S. market growth, driven by AI and anticipated Federal Reserve moves, influencing significant fund flows into BlackRock’s ETFs. The reallocation increases U.S. stocks by 2% while reducing holdings in international developed markets. BlackRock’s move reflects confidence in the U.S. stock market’s trajectory, driven by robust earnings and the anticipation of Federal Reserve rate cuts. As a result, billions of dollars have flowed into BlackRock’s ETFs following the portfolio adjustment. “Our increased allocation to U.S. stocks, particularly in the AI sector, is a testament to our confidence in the growth potential of these technologies.” — Larry Fink, CEO, BlackRock The financial markets have responded favorably to this adjustment. The S&P 500 Index recently reached a historic high this year, supported by AI-driven investment enthusiasm. BlackRock’s decision aligns with widespread market speculation on the Federal Reserve’s next moves, further amplifying investor interest and confidence. AI Surge Propels S&P 500 to Historic Highs At no other time in history has the S&P 500 seen such dramatic gains driven by a single sector as the recent surge spurred by AI investments in 2023. Experts suggest that the strategic increase in U.S. stock exposure by BlackRock may set a precedent for other major asset managers. Historically, shifts of this magnitude have influenced broader market behaviors as others follow suit. Market analysts point to the favorable economic environment and technological advancements that are propelling the AI sector’s momentum. The continued growth of AI technologies is…
Share
BitcoinEthereumNews2025/09/18 02:49
Bitcoin Rainbow chart predicts BTC price for October 1, 2025

Bitcoin Rainbow chart predicts BTC price for October 1, 2025

The post Bitcoin Rainbow chart predicts BTC price for October 1, 2025 appeared on BitcoinEthereumNews.com. The Bitcoin (BTC) Rainbow Chart has outlined potential price ranges for October 1, 2025, as the asset seeks to reclaim the $120,000 resistance. Throughout September, the maiden cryptocurrency has struggled to push past the $115,000 support zone. At press time, Bitcoin was trading at $115,950, up 0.15% in the past 24 hours and gaining a modest 0.5% over the past week. Bitcoin seven-day price chart. Source: Finbold Looking ahead to October 1, the Rainbow Chart projects that Bitcoin’s price could fall within a broad band of $36,628 to $409,726, depending on prevailing market sentiment. The Rainbow Chart, a long-term valuation model often used to track Bitcoin’s price cycles, is built as a logarithmic regression chart. It color-codes Bitcoin’s valuation bands, offering investors a simplified way to gauge whether the market is undervalued or overheated. Bitcoin price prediction  The lowest tier, labeled “Basically a Fire Sale,” spans from $36,628 to $47,947. Above that, the “BUY!” zone ranges from $47,947 to $64,777, while “Accumulate” covers $64,777 to $83,811. The “Still Cheap” band sets Bitcoin between $83,811 and $108,471, followed by the neutral “HODL!” zone at $108,471 to $142,332. Bitcoin Rainbow chart. Source: BlockhainCenter Cautionary levels emerge as prices climb higher. In this case, the “Is this a bubble?” range extends from $142,332 to $181,644, while “FOMO intensifies” lies between $181,644 and $233,215. On the other hand, the red zones, seen as overheated territory, start with “Sell. Seriously, SELL!” at $233,215 to $304,169 and peak with “Maximum Bubble Territory” from $304,169 to $409,726. With Bitcoin trading around $116,000 as of September 20, the Rainbow Chart suggests that by October 1, 2025, the asset will most likely fall within the “Still Cheap” or “HODL!” bands, implying a fair value between $83,811 and $142,332. This outlook indicates that despite Bitcoin’s strong gains, the model places…
Share
BitcoinEthereumNews2025/09/21 01:51