A new drop or a major rally: what comes next for ADA?A new drop or a major rally: what comes next for ADA?

190,000,000 ADA in 1 Week: Is Cardano on the Verge of a Further Dump?

2026/02/13 03:09
3 min read

Cardano’s ADA has been struggling lately, with its price nosediving to a five-year low at the start of February.

While bulls might be eager to see a decisive revival in the short term, the recent actions of the large investors suggest another move south could be on the way.

The Whales Know Something We Don’t?

The renowned analyst Ali Martinez revealed that Cardano whales have dumped approximately 190 million ADA in the past week. The USD equivalent of that stash is roughly $50 million (calculated at ongoing rates of $0.26 per coin).

Seven days ago, the total possessions of this cohort of investors were 13.57 billion ADA, whereas they currently hold around 13.38 billion tokens. The figure represents approximately 36.3% of the asset’s circulating supply.

There is a general assumption in the crypto space that whales are experienced investors who may have inside information about important upcoming events that could influence their buying or selling decisions. That said, their recent actions could spread panic across the community and prompt smaller players to cash out as well.

The purely economic impact is also worth noting. Large sell-offs increase the amount of ADA on the open market, which, combined with non-increasing demand, should lead to a price pullback.

ADA’s Relative Strength Index (RSI) is another bearish factor investors should be wary of. The indicator shows whether the asset is overbought or oversold based on recent price momentum. It ranges from 0 to 100 and helps traders identify when a trend may be about to end.

Readings above 70 signal that ADA has entered overbought territory and could be on the verge of a correction, while ratios below 30 favor a bullish scenario. As of this writing, the RSI stands at around 74.

ADA RSI
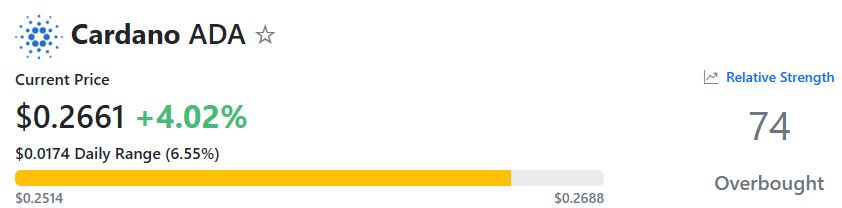
ADA RSI, Source: RSI Hunter

History to Repeat Itself?

ADA is among the cryptocurrencies with vast communities, which consist of proponents and bullish analysts. Just a few days ago, X user Aman noted that the asset’s price has dropped to the demand zone of around $0.26, reminding that in the past this area has sparked major reversals.

Mentor shared a similar viewpoint, arguing that the last time ADA reached current levels, it later rose to nearly $1.40 in less than a month. “History is going to repeat itself soon,” they projected.

Over the last few months, ADA’s exchange netflows have been predominantly negative, which reinforces the optimistic predictions. The trend reflects investors moving coins from centralized platforms to self-custody, reducing the likelihood of short-term selling.

ADA Exchange Netflow
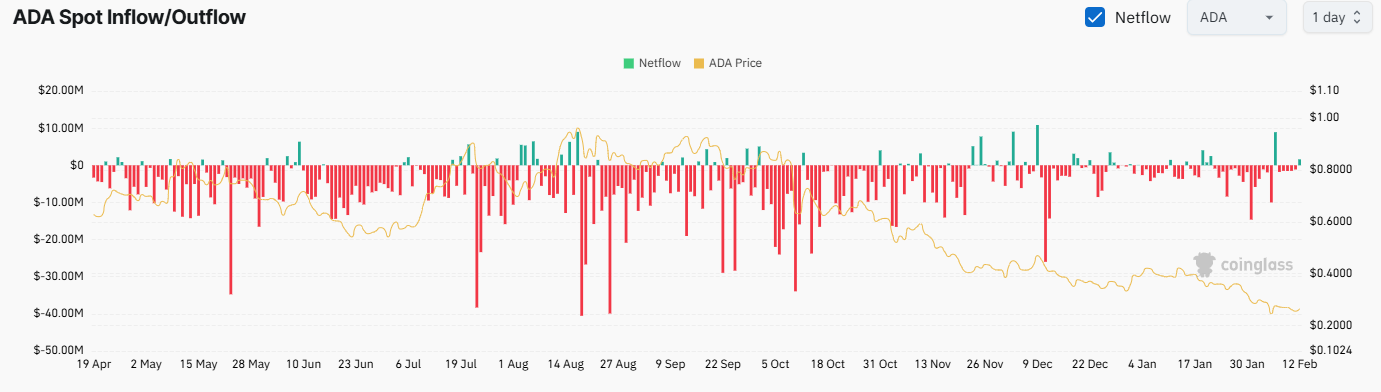
ADA Exchange Netflow, Source: CoinGlass

The post 190,000,000 ADA in 1 Week: Is Cardano on the Verge of a Further Dump? appeared first on CryptoPotato.

Market Opportunity
Cardano Logo
Cardano Price(ADA)
$0.2629
$0.2629$0.2629
+0.11%
USD
Cardano (ADA) Live Price Chart
Disclaimer: The articles reposted on this site are sourced from public platforms and are provided for informational purposes only. They do not necessarily reflect the views of MEXC. All rights remain with the original authors. If you believe any content infringes on third-party rights, please contact service@support.mexc.com for removal. MEXC makes no guarantees regarding the accuracy, completeness, or timeliness of the content and is not responsible for any actions taken based on the information provided. The content does not constitute financial, legal, or other professional advice, nor should it be considered a recommendation or endorsement by MEXC.

You May Also Like

Next Big Crypto? 11B Tokens Sold as APEMARS Stage 7 Closes in 24 Hours – Top 100x Meme Coin 2026 Poised to Outshine Cyber and Floki

Next Big Crypto? 11B Tokens Sold as APEMARS Stage 7 Closes in 24 Hours – Top 100x Meme Coin 2026 Poised to Outshine Cyber and Floki

The meme-coin market is attracting attention as investors search for the next big crypto! Cyber (CYBER) surged 6.93% amid rising trading volume, showing traders
Share
Coinstats2026/02/13 10:15
BlackRock Increases U.S. Stock Exposure Amid AI Surge

BlackRock Increases U.S. Stock Exposure Amid AI Surge

The post BlackRock Increases U.S. Stock Exposure Amid AI Surge appeared on BitcoinEthereumNews.com. Key Points: BlackRock significantly increased U.S. stock exposure. AI sector driven gains boost S&P 500 to historic highs. Shift may set a precedent for other major asset managers. BlackRock, the largest asset manager, significantly increased U.S. stock and AI sector exposure, adjusting its $185 billion investment portfolios, according to a recent investment outlook report.. This strategic shift signals strong confidence in U.S. market growth, driven by AI and anticipated Federal Reserve moves, influencing significant fund flows into BlackRock’s ETFs. The reallocation increases U.S. stocks by 2% while reducing holdings in international developed markets. BlackRock’s move reflects confidence in the U.S. stock market’s trajectory, driven by robust earnings and the anticipation of Federal Reserve rate cuts. As a result, billions of dollars have flowed into BlackRock’s ETFs following the portfolio adjustment. “Our increased allocation to U.S. stocks, particularly in the AI sector, is a testament to our confidence in the growth potential of these technologies.” — Larry Fink, CEO, BlackRock The financial markets have responded favorably to this adjustment. The S&P 500 Index recently reached a historic high this year, supported by AI-driven investment enthusiasm. BlackRock’s decision aligns with widespread market speculation on the Federal Reserve’s next moves, further amplifying investor interest and confidence. AI Surge Propels S&P 500 to Historic Highs At no other time in history has the S&P 500 seen such dramatic gains driven by a single sector as the recent surge spurred by AI investments in 2023. Experts suggest that the strategic increase in U.S. stock exposure by BlackRock may set a precedent for other major asset managers. Historically, shifts of this magnitude have influenced broader market behaviors as others follow suit. Market analysts point to the favorable economic environment and technological advancements that are propelling the AI sector’s momentum. The continued growth of AI technologies is…
Share
BitcoinEthereumNews2025/09/18 02:49
Bitcoin Rainbow chart predicts BTC price for October 1, 2025

Bitcoin Rainbow chart predicts BTC price for October 1, 2025

The post Bitcoin Rainbow chart predicts BTC price for October 1, 2025 appeared on BitcoinEthereumNews.com. The Bitcoin (BTC) Rainbow Chart has outlined potential price ranges for October 1, 2025, as the asset seeks to reclaim the $120,000 resistance. Throughout September, the maiden cryptocurrency has struggled to push past the $115,000 support zone. At press time, Bitcoin was trading at $115,950, up 0.15% in the past 24 hours and gaining a modest 0.5% over the past week. Bitcoin seven-day price chart. Source: Finbold Looking ahead to October 1, the Rainbow Chart projects that Bitcoin’s price could fall within a broad band of $36,628 to $409,726, depending on prevailing market sentiment. The Rainbow Chart, a long-term valuation model often used to track Bitcoin’s price cycles, is built as a logarithmic regression chart. It color-codes Bitcoin’s valuation bands, offering investors a simplified way to gauge whether the market is undervalued or overheated. Bitcoin price prediction  The lowest tier, labeled “Basically a Fire Sale,” spans from $36,628 to $47,947. Above that, the “BUY!” zone ranges from $47,947 to $64,777, while “Accumulate” covers $64,777 to $83,811. The “Still Cheap” band sets Bitcoin between $83,811 and $108,471, followed by the neutral “HODL!” zone at $108,471 to $142,332. Bitcoin Rainbow chart. Source: BlockhainCenter Cautionary levels emerge as prices climb higher. In this case, the “Is this a bubble?” range extends from $142,332 to $181,644, while “FOMO intensifies” lies between $181,644 and $233,215. On the other hand, the red zones, seen as overheated territory, start with “Sell. Seriously, SELL!” at $233,215 to $304,169 and peak with “Maximum Bubble Territory” from $304,169 to $409,726. With Bitcoin trading around $116,000 as of September 20, the Rainbow Chart suggests that by October 1, 2025, the asset will most likely fall within the “Still Cheap” or “HODL!” bands, implying a fair value between $83,811 and $142,332. This outlook indicates that despite Bitcoin’s strong gains, the model places…
Share
BitcoinEthereumNews2025/09/21 01:51