Sui (SUI) Price: Technical Analysis Points to $4.00 Target as Token Tests Support

TLDR
- Sui is currently trading at $3.45, up 3.25% in 24 hours with $2.24 billion daily volume
- Key support level at $3.50 being tested, with potential upside target of $3.70-$4.00
- Cetus, the largest Sui DEX, maintains steady $170.7M daily volume despite competition
- Network’s average DEX volume grew 21% quarter-over-quarter to $368 million
- Technical indicators show mixed signals with price below 50-day moving average of $3.69
Sui has shown modest gains in the past 24 hours, though market signals remain mixed as the cryptocurrency faces critical technical levels. Trading at $3.45 at the time of writing, SUI has experienced a 3.25% increase over the last day, with a substantial 24-hour trading volume of $2.24 billion and a market capitalization of $8.06 billion.
The token is currently testing important support levels after slipping below its 50-day moving average of $3.69 and dropping under the pivot point of $3.46. This price action comes as network activity shows uneven growth across decentralized exchanges on the Sui blockchain.
On-chain data reveals an interesting dynamic within the Sui ecosystem. While the network’s average daily DEX volume increased by 21% quarter-over-quarter to reach $368 million, this growth has been inconsistent across different platforms.
Smaller protocols have experienced explosive growth. Momentum saw an astounding 8,594% increase, while FlowX Finance grew by 1,548%. These dramatic rises suggest that innovation is successfully drawing users toward newer exchanges on the network.
In contrast, Cetus, which remains the largest DEX on Sui, has maintained steady performance with $170.7 million in daily volume. This indicates a consolidation of its position despite the emergence of new competitors.
Technical Analysis
From a technical perspective, SUI is under pressure following its dip below key levels. The MACD histogram reading of -0.0293 indicates that downward momentum may still be in play, making the coming days crucial for determining price direction.
Market analysts are closely watching to see if SUI can regain support above $3.50, which would help re-establish market confidence. A sustained breakout above this level could potentially open the door to the $3.70-$4.00 range.
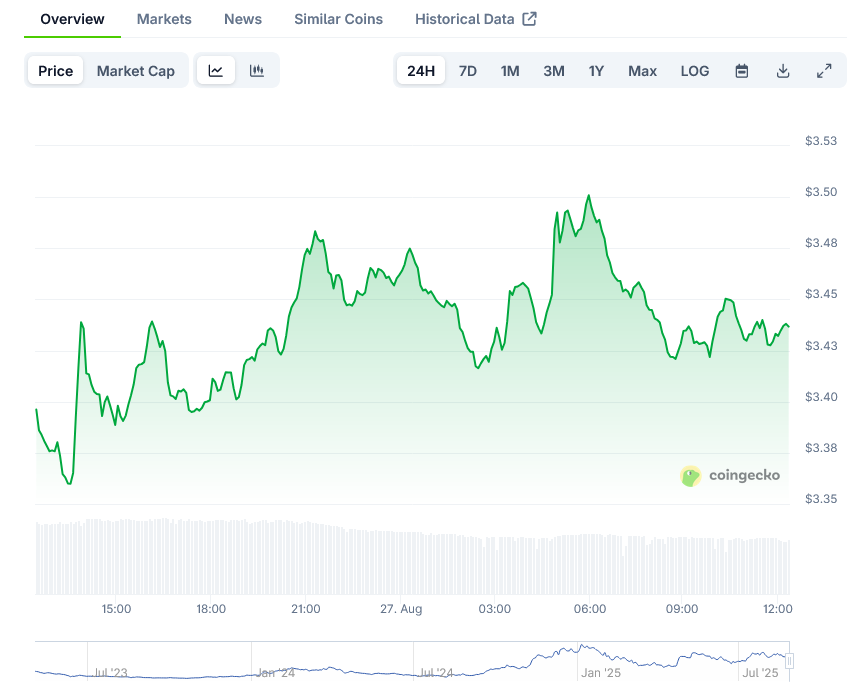 Sui Price on CoinGecko
However, continued weakness might test lower support levels around $3.20. This technical structure aligns with fractal analysis that suggests SUI may be entering a consolidation phase before a potential breakout.
The price correction patterns observed in SUI mirror historical movements from 2023 and 2025, with key support levels at $2.80 and $2.62 representing important zones should the current support fail to hold.
Derivatives Market Insights
The derivatives market for SUI presents a mixed picture. Volume has declined by 14.03% to $5.21 billion, while open interest rose moderately by 3.66% to $1.88 billion. This divergence signals dampening short-term activity despite ongoing locked-in capital.
The OI-Weighted funding rate stands at 0.0089%, indicating a slight positive bias in the market. Long positions remain marginally dominant, but the low rate suggests a balanced market view without strong conviction in either direction.
This cautious sentiment in the derivatives market is further reflected in trading patterns, with shorts accounting for approximately 55% of volume.
Despite short-term price pressures, SUI’s ecosystem shows signs of strength and continued development. The network has attracted $450 million in private investment, demonstrating institutional confidence in its long-term viability.
Trading volumes across decentralized exchanges have exceeded $14 billion, highlighting the token’s growing utility and adoption within the broader cryptocurrency ecosystem.
Macroeconomic factors and token unlocks have added complexity to SUI’s short-term price trajectory. Increased supply from token unlocks may have contributed to the recent downward pressure.
The next few days will be critical for SUI as traders watch to see if the token can hold above $3.45 and potentially reclaim the $3.50 level. A successful defense of this support zone could set the stage for a move toward the $4.00 target that many analysts have identified.
Current price action shows SUI at $3.45, with resistance at $3.70 and support at $3.20. The market remains balanced but cautious as traders await clearer directional signals.
The post Sui (SUI) Price: Technical Analysis Points to $4.00 Target as Token Tests Support appeared first on Blockonomi.


You May Also Like

African Tech Investment London: ATS 2026 at LSE

Best Crypto Presales to Watch While Iran Slams “Collusion”