

Render (RENDER) Price Rebuilding Strength as AI Tokens Stabilize
RENDER is finally showing real life. The Render price is up nearly 10% in the last 24 hours, trading around $1.50. That kind of relative strength usually means something is changing under the surface.
This rally isn’t coming out of nowhere. Social sentiment around AI tokens has turned positive again, and traders are pointing to a clean technical reclaim above key moving averages. In a market that has been cautious with altcoins, the Render price is quietly stepping back into focus.
Read Also: Japan Stocks Flash Rare Signal Not Seen Since 2005
The Render Downtrend Was Clear – Until Now
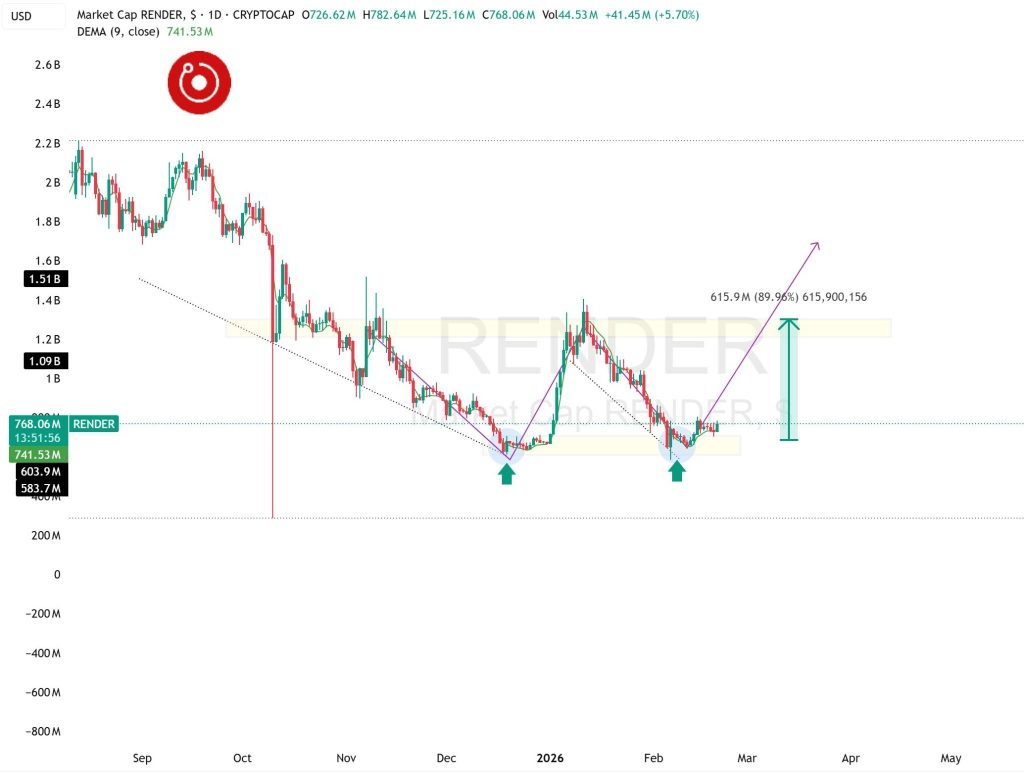
If you zoom out on the daily chart shared by Crypto Winkle, the broader picture shows a long grind lower. Market cap rolled over from above $2 billion and drifted down through late 2025. Every bounce got capped by a descending trendline, and momentum kept fading.
 Source: X/@CryptoWinkle
Then something shifted. The chart shows a clear basing structure forming near the $600 million zone. Two rounded lows formed, and each time buyers stepped in at roughly the same area. That’s often how reversals begin, not with explosive candles, but with quiet accumulation.
From that base, the Render price pushed up and broke above the descending structure that had been holding it down. That’s the first real structural change in months.
There’s even a projected move on the chart pointing toward a reclaim of the $1.2 billion market cap area, which used to act as support before the breakdown. If that plays out, it would represent a meaningful recovery from the recent lows.
Momentum Is Turning in the Right Direction
The technical side supports the move. The Render price has climbed back above key moving averages, and RSI is turning up from neutral territory. That’s often how short-term trend changes begin, momentum shifts first, then price follows.
What’s interesting is that this isn’t happening in isolation. AI-related tokens have started defending higher lows across the board. Even during recent altcoin weakness, the sector hasn’t completely rolled over.
There’s also evidence of larger holders accumulating during the basing phase. When bigger players step in near support, it usually signals demand that goes beyond short-term retail trading.
Read Also: Global Market Collapse Next Week? Fed Liquidity Moves Raise Red Flags Across Stocks And Crypto
What Comes Next for RENDER
For the Render price, the key near-term level sits around $1.42. As long as the price remains above the pivot, the setup for the breakout remains. If the trend continues upward, the target for the stock will be the 50 percent Fibonacci, or $1.64.
However, as long as the momentum remains high and the market continues upward, the stock may revisit the resistance at $1.80. On the flip side, if the price begins to decline again, below $1.42, the $1.36 zone will again come under threat. Losing that would likely stall the recovery narrative.
What makes this move interesting is the tone. The Render price isn’t ripping higher on hype alone. It’s reclaiming structure after months of steady decline, and it’s doing so as AI tokens start stabilizing again.
The downtrend has been challenged. Higher lows are forming. Momentum has flipped positive. Now it comes down to follow-through. If buyers defend this breakout area, the groundwork for a larger move is already there.
Subscribe to our YouTube channel for daily crypto updates, market insights, and expert analysis.
The post Render (RENDER) Price Rebuilding Strength as AI Tokens Stabilize appeared first on CaptainAltcoin.


You May Also Like

Shield: CFO of Doginal Dogs

Ranjan Roy: AI is shifting towards consumption-based models, public fear stems from rapid advancements, and large language models are often overhyped


