According to Artemis, in August the on-chain volumes of stablecoins approached ~3 trillion dollars (approximately +92% month over month)According to Artemis, in August the on-chain volumes of stablecoins approached ~3 trillion dollars (approximately +92% month over month)

Stablecoin, record August: volumes at 3,000 billion and market cap at 284.6 billion

stablecoin market

According to Artemis, in August the on-chain volumes of stablecoins approached ~3 trillion dollars (approximately +92% month over month), while the aggregated market capitalization reached 284.6 billion dollars, as reported by DeFiLlama. This acceleration indicates increasing liquidity, broader adoption, and a rapidly maturing ecosystem. It should be noted that the dynamic is not uniform across all networks, but the overall signal remains clear.

A significant portion of the growth reflects both cross-chain arbitrage flows and an increase in operations related to payment services and derivatives markets. Industry analysts note that the market concentration on USDT (about 59% of the capitalization) has amplified the impact of supply and demand movements. Data and percentages refer to August; for real-time values, it is recommended to consult the mentioned dashboards.

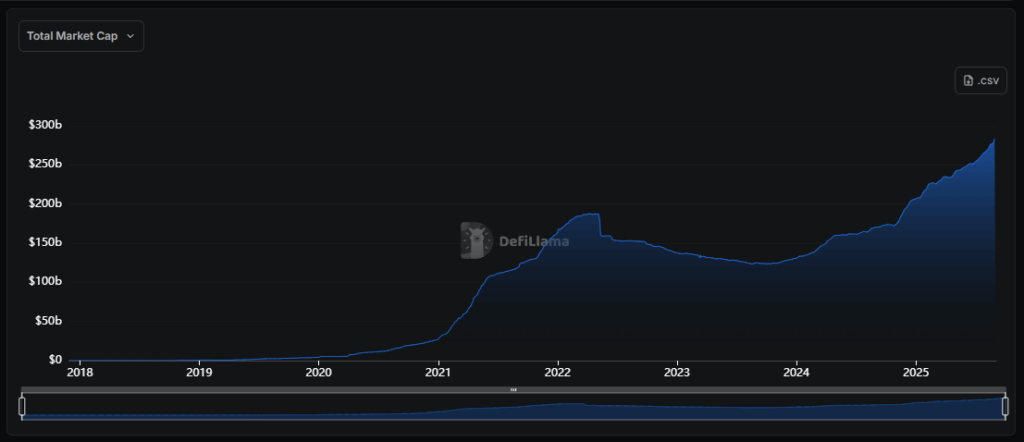
Trend of the total market cap of the stablecoin market. Source: DefiLlama

In brief

  • Market cap stablecoin: $284.6 billion, with an increase of approximately $17.5 billion over the month.
  • On-chain volumes: ~$3,000 billion, +92% m/m.
  • Number of transactions: ~1.2 billion, +16.9% m/m.
  • Unique addresses: 41.7 million, approximately +25% m/m.
  • Dominant networks: Ethereum and Tron remain the main liquidity hubs.

Market Size and Dynamics of August

The stablecoin market closed August at 284.6 billion dollars, an increase of about 17.5 billion compared to the beginning of the month. In parallel, on-chain volumes surged to ~3,000 billion, indicating intense usage across multiple use cases and networks. Consequently, the demand for on-chain dollars remained high despite the volatility of the broader crypto market.

This trend is consistent with an expansion of supply and more widespread adoption in DeFi protocols and payments. In this context, operational use ranges from remittances and rapid settlement to liquidity strategies on AMM and derivatives markets. 

Ethereum offers the greatest market depth, while Tron captures significant cross-border flows at low costs; at the same time, several Layer‑2 rollups are rapidly consolidating their share. An interesting aspect is that part of the transfer volume may reflect internal movements and arbitrage between protocols, but the trend remains indicative of sustained usage.

Who Led the Growth: Key Issuers and Tokens

The supply variations show a concentrated contribution on the main dollar-pegged assets. It should be noted that the trajectory of the issuers highlights differences between retail use, DeFi, and institutional scope, with demand dynamics not always simultaneous.

| Stablecoin | Cap/Indicative Supply | Share/Change | Notes |
| ———————————————————————————– | ————————— | ———————- | ——————————————————————– |
| USDT (Tether) | ~$167.97 billion | ~59% of the market | Established leadership and broad cross‑chain presence |
| USDC (Circle) | ~$71.85 billion | +$7.98 billion for the month | Recovery of share in DeFi apps and institutional space |
| USDe (Ethena) | ~$12.403 billion | ~+41% m/m | Sustained growth on yield protocols |
| DAI | Increase ~+$880 million | — | Stable adoption in DeFi space thanks to composite collateral |
| USD1 | +$349 million | — | Gradual expansion of the offering |
| PYUSD (PayPal) | > $1 billion | — | Symbolic threshold surpassed in August |

Leverage behind the surge in volumes

  • On-chain payments are becoming more frequent, especially for fast and low-cost transfers in the cross-border context.
  • Greater integration of stablecoins in DeFi, especially in the areas of lending, AMMs, and perpetual markets.
  • Enhanced interoperability thanks to cross-chain bridges and more efficient Layer-2 rollups.
  • Increase in issuance by major issuers, in line with institutional demand.

The infrastructure that supports liquidity

The liquidity of stablecoins is based on decentralized exchanges, deep liquidity pools, and cross-chain bridges. Ethereum remains the nerve center for tools and depth, while Tron and various Layer-2 solutions offer reduced fees and faster transactions, ensuring greater exchange efficiency and lower average costs for value transfer. In this context, routing between pools and access to perpetual markets help maintain low spreads and keep slippage under control.

International Payments: The Role of Stablecoins

Stablecoins are now a key element for remittances and B2B/B2C cross-border payments. The interest of major operators, along with surpassing the 1 billion dollars capitalization threshold for PYUSD in August, confirms a growing use both on the consumer and merchant fronts. An interesting aspect is the combination of near-instant settlements and reduced costs, with however marked differences between geographical areas and local regulatory requirements.

Addresses and Users: What the Increase Indicates

The increase to 41.7 million unique addresses connected to stablecoins suggests expanding adoption, driven by lightweight wallets, payment apps, and DeFi protocols. However, the strong concentration on Ethereum and Tron represents both an advantage in terms of efficiency and a potential systemic risk if bottlenecks or regulatory shocks emerge on a specific network. It should be noted, for completeness, that addresses do not necessarily equate to verified unique users and may include multiple accounts for a single user.

Implications for Market and Regulation

  • Closer monitoring of emissions and reserves supporting the fiat peg.
  • A growing demand for transparency and shared standards related to attestations and audits.
  • Pressure on the basic infrastructure (bridge, L2, oracles) if volumes remain high.

What to Monitor in the Coming Months

  • The evolution of market shares between USDT, USDC, and new issuers.
  • The trend of on-chain volumes on emerging networks and rollups.
  • Any regulatory updates concerning issuances, custody, and reserves.
Market Opportunity
Capverse Logo
Capverse Price(CAP)
$0.13131
$0.13131$0.13131
-1.18%
USD
Capverse (CAP) Live Price Chart
Disclaimer: The articles reposted on this site are sourced from public platforms and are provided for informational purposes only. They do not necessarily reflect the views of MEXC. All rights remain with the original authors. If you believe any content infringes on third-party rights, please contact service@support.mexc.com for removal. MEXC makes no guarantees regarding the accuracy, completeness, or timeliness of the content and is not responsible for any actions taken based on the information provided. The content does not constitute financial, legal, or other professional advice, nor should it be considered a recommendation or endorsement by MEXC.

You May Also Like

Mitosis Price Flashes a Massive Breakout Hope; Cup-And-Handle Pattern Signals MITO Targeting 50% Rally To $0.115305 Level

Mitosis Price Flashes a Massive Breakout Hope; Cup-And-Handle Pattern Signals MITO Targeting 50% Rally To $0.115305 Level

The analyst identified a formation of a cup-and-handle pattern on Mitosis’s chart, suggesting that MITO is preparing to see a looming price explosion.
Share
Blockchainreporter2026/01/18 09:00
Spot ETH ETFs Surge: Remarkable $48M Inflow Streak Continues

Spot ETH ETFs Surge: Remarkable $48M Inflow Streak Continues

BitcoinWorld Spot ETH ETFs Surge: Remarkable $48M Inflow Streak Continues The cryptocurrency world is buzzing with exciting news as Spot ETH ETFs continue to capture significant investor attention. For the second consecutive day, these innovative investment vehicles have seen substantial positive flows, reinforcing confidence in the Ethereum ecosystem. This consistent performance signals a growing appetite for regulated crypto exposure among traditional investors. What’s Fueling the Latest Spot ETH ETF Inflows? On September 19, U.S. Spot ETH ETFs collectively recorded a net inflow of an impressive $48 million. This marked another day of positive momentum, building on previous gains. Such figures are not just numbers; they represent tangible capital moving into the Ethereum market through accessible investment products. BlackRock’s ETHA Leads the Charge: A standout performer was BlackRock’s ETHA, which alone attracted a staggering $140 million in inflows. This substantial figure highlights the significant influence of major financial institutions in driving the adoption of crypto-backed ETFs. Institutional Confidence: The consistent inflows, particularly from prominent asset managers like BlackRock, suggest increasing institutional comfort and conviction in Ethereum’s long-term potential. Why Are Consecutive Spot ETH ETF Inflows So Significant? Two consecutive days of net inflows into Spot ETH ETFs are more than just a fleeting trend; they indicate a strengthening pattern of investor interest. This sustained positive movement suggests that initial hesitancy might be giving way to broader acceptance and strategic positioning within the digital asset space. Understanding the implications of these inflows is crucial: Market Validation: Continuous inflows serve as a strong validation for Ethereum as a legitimate and valuable asset class within traditional finance. Liquidity and Stability: Increased capital flowing into these ETFs can contribute to greater market liquidity and potentially enhance price stability for Ethereum itself, reducing volatility over time. Paving the Way: The success of Spot ETH ETFs could also pave the way for other cryptocurrency-based investment products, further integrating digital assets into mainstream financial portfolios. Are All Spot ETH ETFs Experiencing the Same Momentum? While the overall picture for Spot ETH ETFs is overwhelmingly positive, it’s important to note that individual fund performances can vary. The market is dynamic, and different funds may experience unique flow patterns based on investor preferences, fund structure, and underlying strategies. Mixed Performance: On the same day, Fidelity’s FETH saw net outflows of $53.4 million, and Grayscale’s Mini ETH recorded outflows of $11.3 million. Normal Market Fluctuations: These outflows, while notable, are a normal part of market dynamics. Investors might be rebalancing portfolios, taking profits, or shifting capital between different investment vehicles. The net positive inflow across the entire sector indicates that new money is still entering faster than it is leaving. This nuanced view helps us appreciate the complex interplay of forces shaping the market for Spot ETH ETFs. What’s Next for Spot ETH ETFs and the Ethereum Market? The sustained interest in Spot ETH ETFs suggests a potentially bright future for Ethereum’s integration into traditional financial markets. As more investors gain access to ETH through regulated products, the demand for the underlying asset could increase, influencing its price and overall market capitalization. For investors looking to navigate this evolving landscape, here are some actionable insights: Stay Informed: Keep an eye on daily inflow and outflow data, as these can provide early indicators of market sentiment. Understand Diversification: While Spot ETH ETFs offer exposure, remember the importance of a diversified investment portfolio. Monitor Regulatory Developments: The regulatory environment for cryptocurrencies is constantly evolving, which can impact the performance and availability of these investment products. Conclusion: A Promising Horizon for Ethereum The consistent positive net inflows into Spot ETH ETFs for a second straight day underscore a significant shift in how institutional and retail investors view Ethereum. This growing confidence, spearheaded by major players like BlackRock, signals a maturing market where digital assets are increasingly seen as viable components of a modern investment strategy. As the ecosystem continues to develop, these ETFs will likely play a crucial role in shaping Ethereum’s future trajectory and its broader acceptance in global finance. It’s an exciting time to watch the evolution of these groundbreaking financial instruments. Frequently Asked Questions (FAQs) Q1: What is a Spot ETH ETF? A Spot ETH ETF (Exchange-Traded Fund) is an investment product that directly holds Ethereum. It allows investors to gain exposure to Ethereum’s price movements without needing to buy, store, or manage the actual cryptocurrency themselves. Q2: Why are these recent inflows into Spot ETH ETFs important? The recent inflows signify growing institutional and retail investor confidence in Ethereum as an asset. Consistent positive flows can lead to increased market liquidity, potential price stability, and broader acceptance of cryptocurrencies in traditional financial portfolios. Q3: Which funds are leading the inflows for Spot ETH ETFs? On September 19, BlackRock’s ETHA led the group with a substantial $140 million in inflows, demonstrating strong interest from a major financial institution. Q4: Do all Spot ETH ETFs experience inflows simultaneously? No, not all Spot ETH ETFs experience inflows at the same time. While the overall sector may see net positive flows, individual funds like Fidelity’s FETH and Grayscale’s Mini ETH can experience outflows due to various factors such as rebalancing or profit-taking by investors. Q5: What does the success of Spot ETH ETFs mean for Ethereum’s price? Increased demand through Spot ETH ETFs can potentially drive up the price of Ethereum by increasing buying pressure on the underlying asset. However, numerous factors influence crypto prices, so it’s not a guaranteed outcome. If you found this article insightful, consider sharing it with your network! Your support helps us continue to provide valuable insights into the dynamic world of cryptocurrency. Spread the word and help others understand the exciting developments in Spot ETH ETFs! To learn more about the latest crypto market trends, explore our article on key developments shaping Ethereum institutional adoption. This post Spot ETH ETFs Surge: Remarkable $48M Inflow Streak Continues first appeared on BitcoinWorld.
Share
Coinstats2025/09/20 11:10
Trump imposes 10% tariffs on eight European countries over Greenland.

Trump imposes 10% tariffs on eight European countries over Greenland.

PANews reported on January 18th that, according to Jinshi News, on January 17th local time, US President Trump announced via social media that, due to the Greenland
Share
PANews2026/01/18 08:46