Ethereum bulls pushed its price to nearly $2,200 on Thursday amid a market-wide recovery. According to data from crypto.news, Ethereum (ETH) price rallied over Ethereum bulls pushed its price to nearly $2,200 on Thursday amid a market-wide recovery. According to data from crypto.news, Ethereum (ETH) price rallied over

Can Ethereum price reclaim $2,400 as it eyes a bullish reversal amid market recovery?

2026/03/05 14:29
3 min read
For feedback or concerns regarding this content, please contact us at crypto.news@mexc.com

Ethereum bulls pushed its price to nearly $2,200 on Thursday amid a market-wide recovery.

Summary
  • Ethereum price rebounded to a 4-week high on Friday amid increased demand from institutional traders and a surge in short liquidations.
  • ETH has formed a double bottom pattern on the daily chart.

According to data from crypto.news, Ethereum (ETH) price rallied over 11% to a 4-week high of $2,192.

Ethereum price rallied amid a broader market recovery led by Bitcoin. The bellwether reclaimed the $73,000 mark for the first time since early February as reports emerged that the U.S. and Iran could be negotiating a deal to end their military confrontation. 

As ETH price rose, it triggered a short squeeze of traders with highly leveraged bearish bets in the derivatives market. Data from CoinGlass show over $133 million in short positions were liquidated in the past 24 hours, compared to only $21.5 million in long positions.

A return of inflows into spot Ethereum ETFs also seems to suggest that institutional investors had played a significant part in the recovery. Per data compiled by Farside Investors, spot Ethereum ETFs drew in $169.4 million yesterday.

Simultaneously, Ethereum’s open interest shot up nearly 15%, which is a sign of increased derivatives market activity after multiple days of stagnation. While the weighted funding rate remains negative at press time, if it continues to climb, a shift toward positive funding rates could signal a return of bullish sentiment. 

This surge in activity suggests that traders are once again aggressively positioning themselves, potentially setting the stage for more volatility if the price breaks key resistance levels.

Ethereum price analysis

On the daily chart, Ethereum price has formed a double bottom pattern, a major bullish reversal pattern formed of two consecutive troughs. The neckline of the pattern lies at the $2,200 psychological resistance level.

Ethereum price has formed a bearish flag on the daily chart.

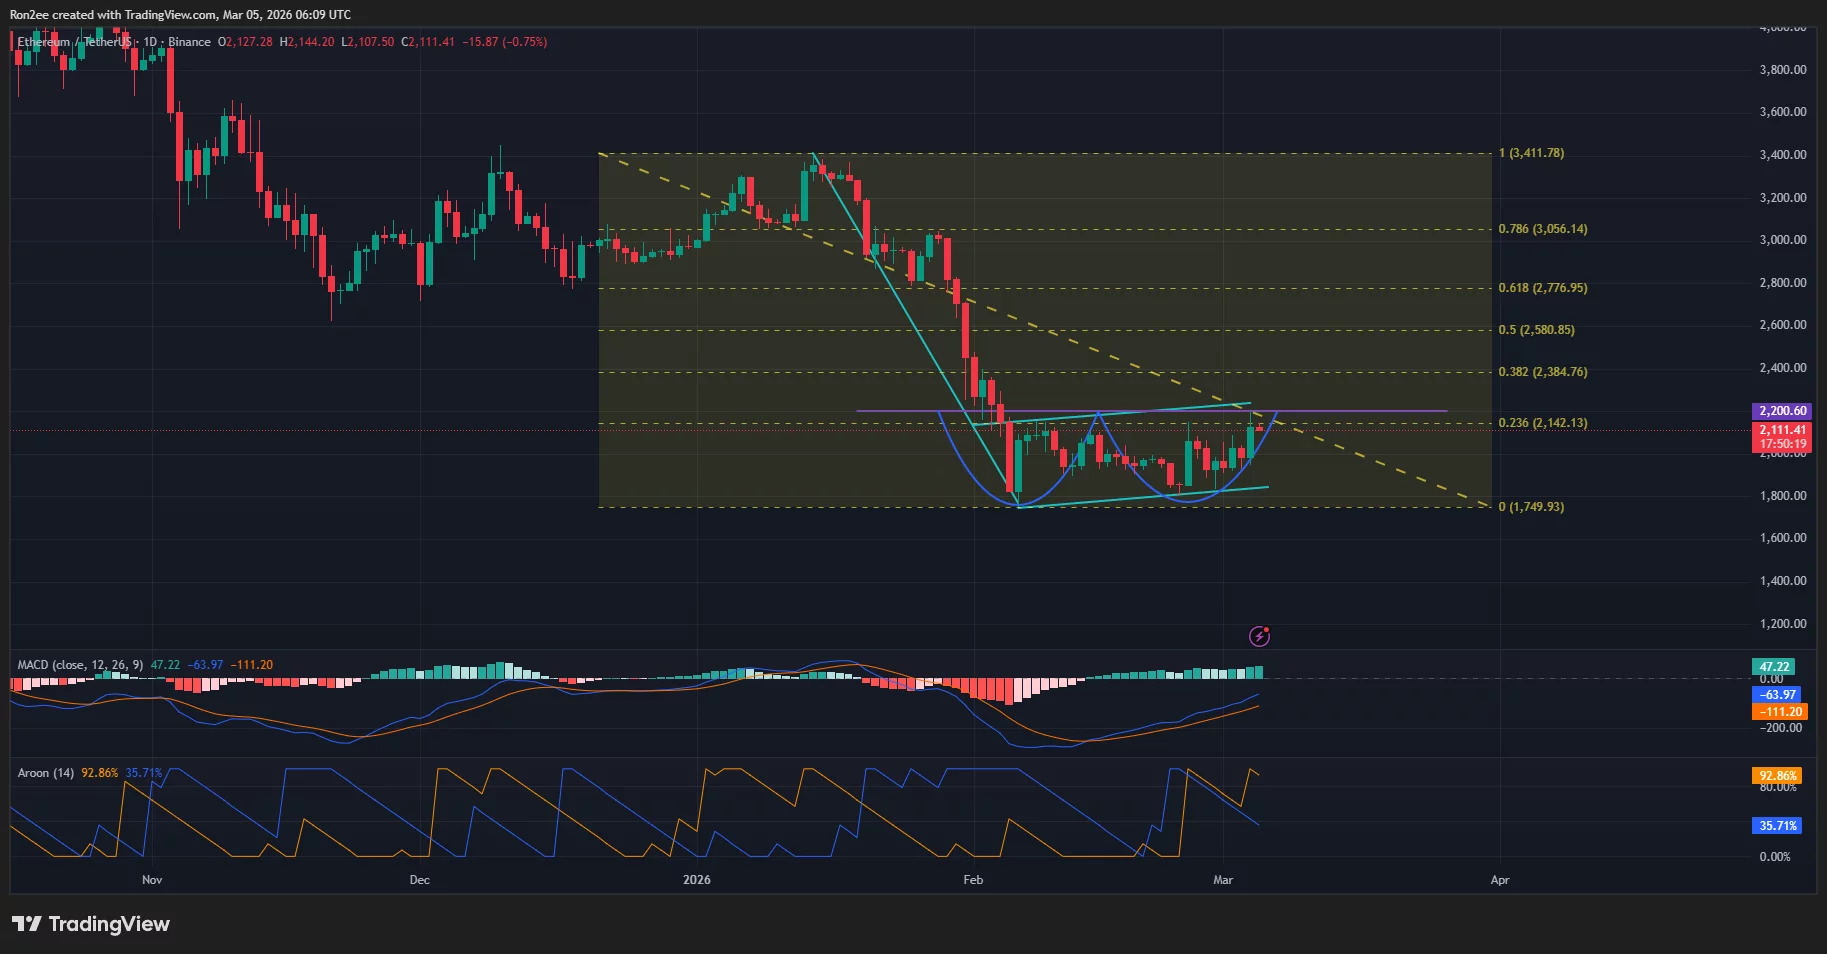
A breakout from the neckline could push Ethereum to $2,400, which aligns with the 38.2% Fibonacci retracement level that is often seen as a critical target for a trend reversal.

It should also be noted that a successful reclaiming of the $2,400 mark would invalidate a larger bearish flag pattern forming on the chart.

Key technical indicators seem to suggest that bulls are already on the move. Notably, the MACD lines have formed a bullish crossover and were pointing upwards, while the Aroon Up showed a reading of 92.86%, far above the bearish indicator at 35.71%.

For now, traders are eyeing $2,142, the 23.6% Fibonacci retracement level, as a key resistance. ETH was trading at $2,117 when writing, just 1.1% below that mark.

Disclosure: This article does not represent investment advice. The content and materials featured on this page are for educational purposes only.

Market Opportunity
Bullish Degen Logo
Bullish Degen Price(BULLISH)
$0.004477
$0.004477$0.004477
-6.96%
USD
Bullish Degen (BULLISH) Live Price Chart
Disclaimer: The articles reposted on this site are sourced from public platforms and are provided for informational purposes only. They do not necessarily reflect the views of MEXC. All rights remain with the original authors. If you believe any content infringes on third-party rights, please contact crypto.news@mexc.com for removal. MEXC makes no guarantees regarding the accuracy, completeness, or timeliness of the content and is not responsible for any actions taken based on the information provided. The content does not constitute financial, legal, or other professional advice, nor should it be considered a recommendation or endorsement by MEXC.

You May Also Like

Litecoin Fluctuates Below The $116 Threshold

Litecoin Fluctuates Below The $116 Threshold

The post Litecoin Fluctuates Below The $116 Threshold appeared on BitcoinEthereumNews.com. Sep 17, 2025 at 23:05 // Price Litecoin price analysis by Coinidol.com: LTC price has slipped below the moving average lines after hitting resistance at $120. Litecoin price long-term prediction: bearish The 21-day SMA support helped to alleviate the selling pressure. In other words, the price of the cryptocurrency is above the 21-day SMA support but below the 50-day SMA barrier. This suggests that Litecoin will be trapped in a narrow range for a few days. If the 21-day SMA support or the 50-day SMA barrier is overreached, the cryptocurrency will trend upwards. For example, if the LTC price breaks through the 50-day SMA barrier, it will rise to a high of $124. Litecoin will fall to its current support level of $106 if the 21-day SMA support is broken. Technical Indicators  Resistance Levels: $100, $120, $140 Support Levels: $60, $40, $20 LTC price indicators analysis Litecoin’s price is squeezed between the moving average lines. It is unclear in which direction Litecoin will move. The moving average lines are horizontal in both charts. However, the price bars are limited to the distance between the moving averages. The price bars on the 4-hour chart are below the moving average lines. LTC/USD price chart – September 17, 2025 What is the next move for LTC? On the 4-hour chart, Litecoin is currently trading in a bearish trend zone. The altcoin is trading above the $112 support and below the moving average lines, which represent resistance at $116. The upward movement is hindered by the moving average lines, which are causing the price to oscillate within a limited range. Meanwhile, the signal for the cryptocurrency is bearish, with price bars below the moving average…
Share
BitcoinEthereumNews2025/09/18 08:15
CME to launch Solana and XRP futures options on October 13, 2025

CME to launch Solana and XRP futures options on October 13, 2025

The post CME to launch Solana and XRP futures options on October 13, 2025 appeared on BitcoinEthereumNews.com. Key Takeaways CME Group will launch futures options for Solana (SOL) and XRP. The launch date is set for October 13, 2025. CME Group will launch futures options for Solana and XRP on October 13, 2025. The Chicago-based derivatives exchange will add the new crypto derivatives products to its existing digital asset offerings. The launch will provide institutional and retail traders with additional tools to hedge positions and speculate on price movements for both digital assets. The futures options will be based on CME’s existing Solana and XRP futures contracts. Trading will be conducted through CME Globex, the exchange’s electronic trading platform. Source: https://cryptobriefing.com/cme-solana-xrp-futures-options-launch-2025/
Share
BitcoinEthereumNews2025/09/18 01:07
US-Israel airstrikes trigger 700% surge in Iran crypto outflows

US-Israel airstrikes trigger 700% surge in Iran crypto outflows

The post US-Israel airstrikes trigger 700% surge in Iran crypto outflows appeared on BitcoinEthereumNews.com. Homepage > News > Business > US-Israel airstrikes
Share
BitcoinEthereumNews2026/03/05 16:01